
Your CPU delivers what it promises.
Hot doesn't always mean slow. Slow doesn't always mean hot.
A laptop can sit at 95 °C and perform perfectly. Or stay cool and run at half speed because the charger can't deliver more. Temperature monitors show you the number; ThrottleWatch tells you what to do about it.
Heat The processor lowers its clock to protect itself. Better cooling helps.
Power The machine has reached its electrical limit. Better cooling barely changes anything.
Device The manufacturer, the charger or the battery is holding it back. The fix is something else.
Three steps. Zero setup.
1 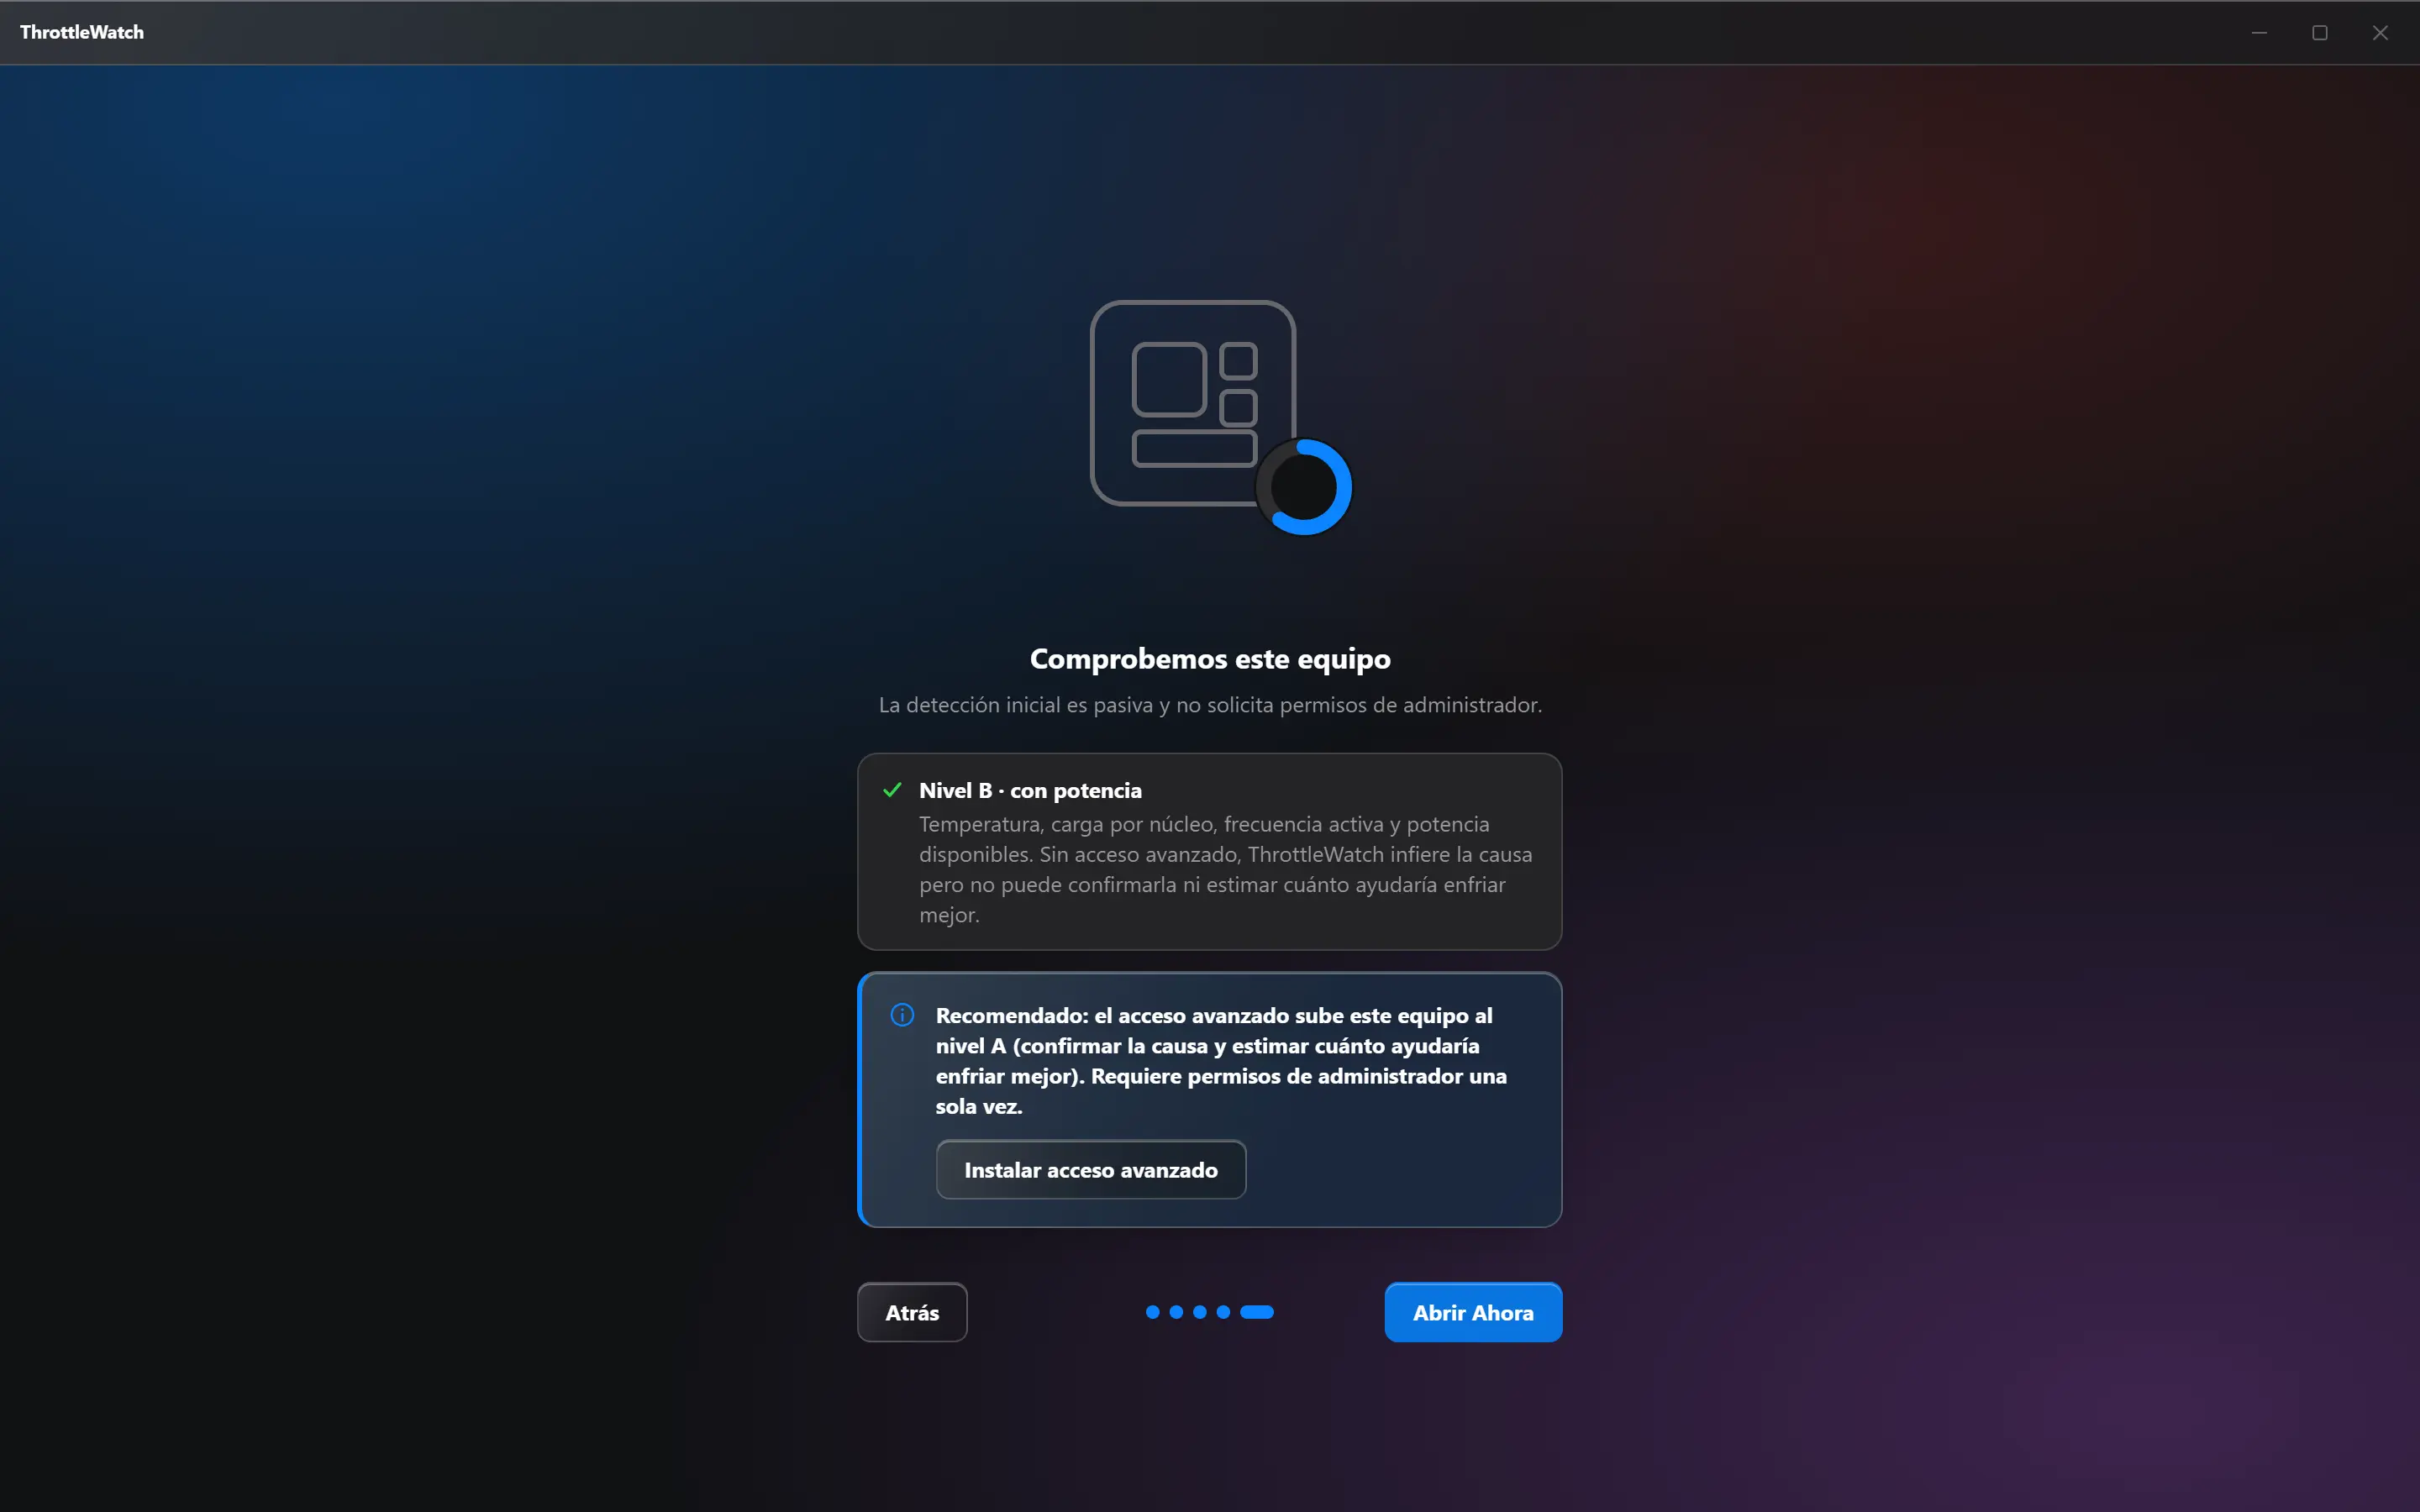
Open ThrottleWatch.
It detects your processor and its sensors without asking for permissions.
2 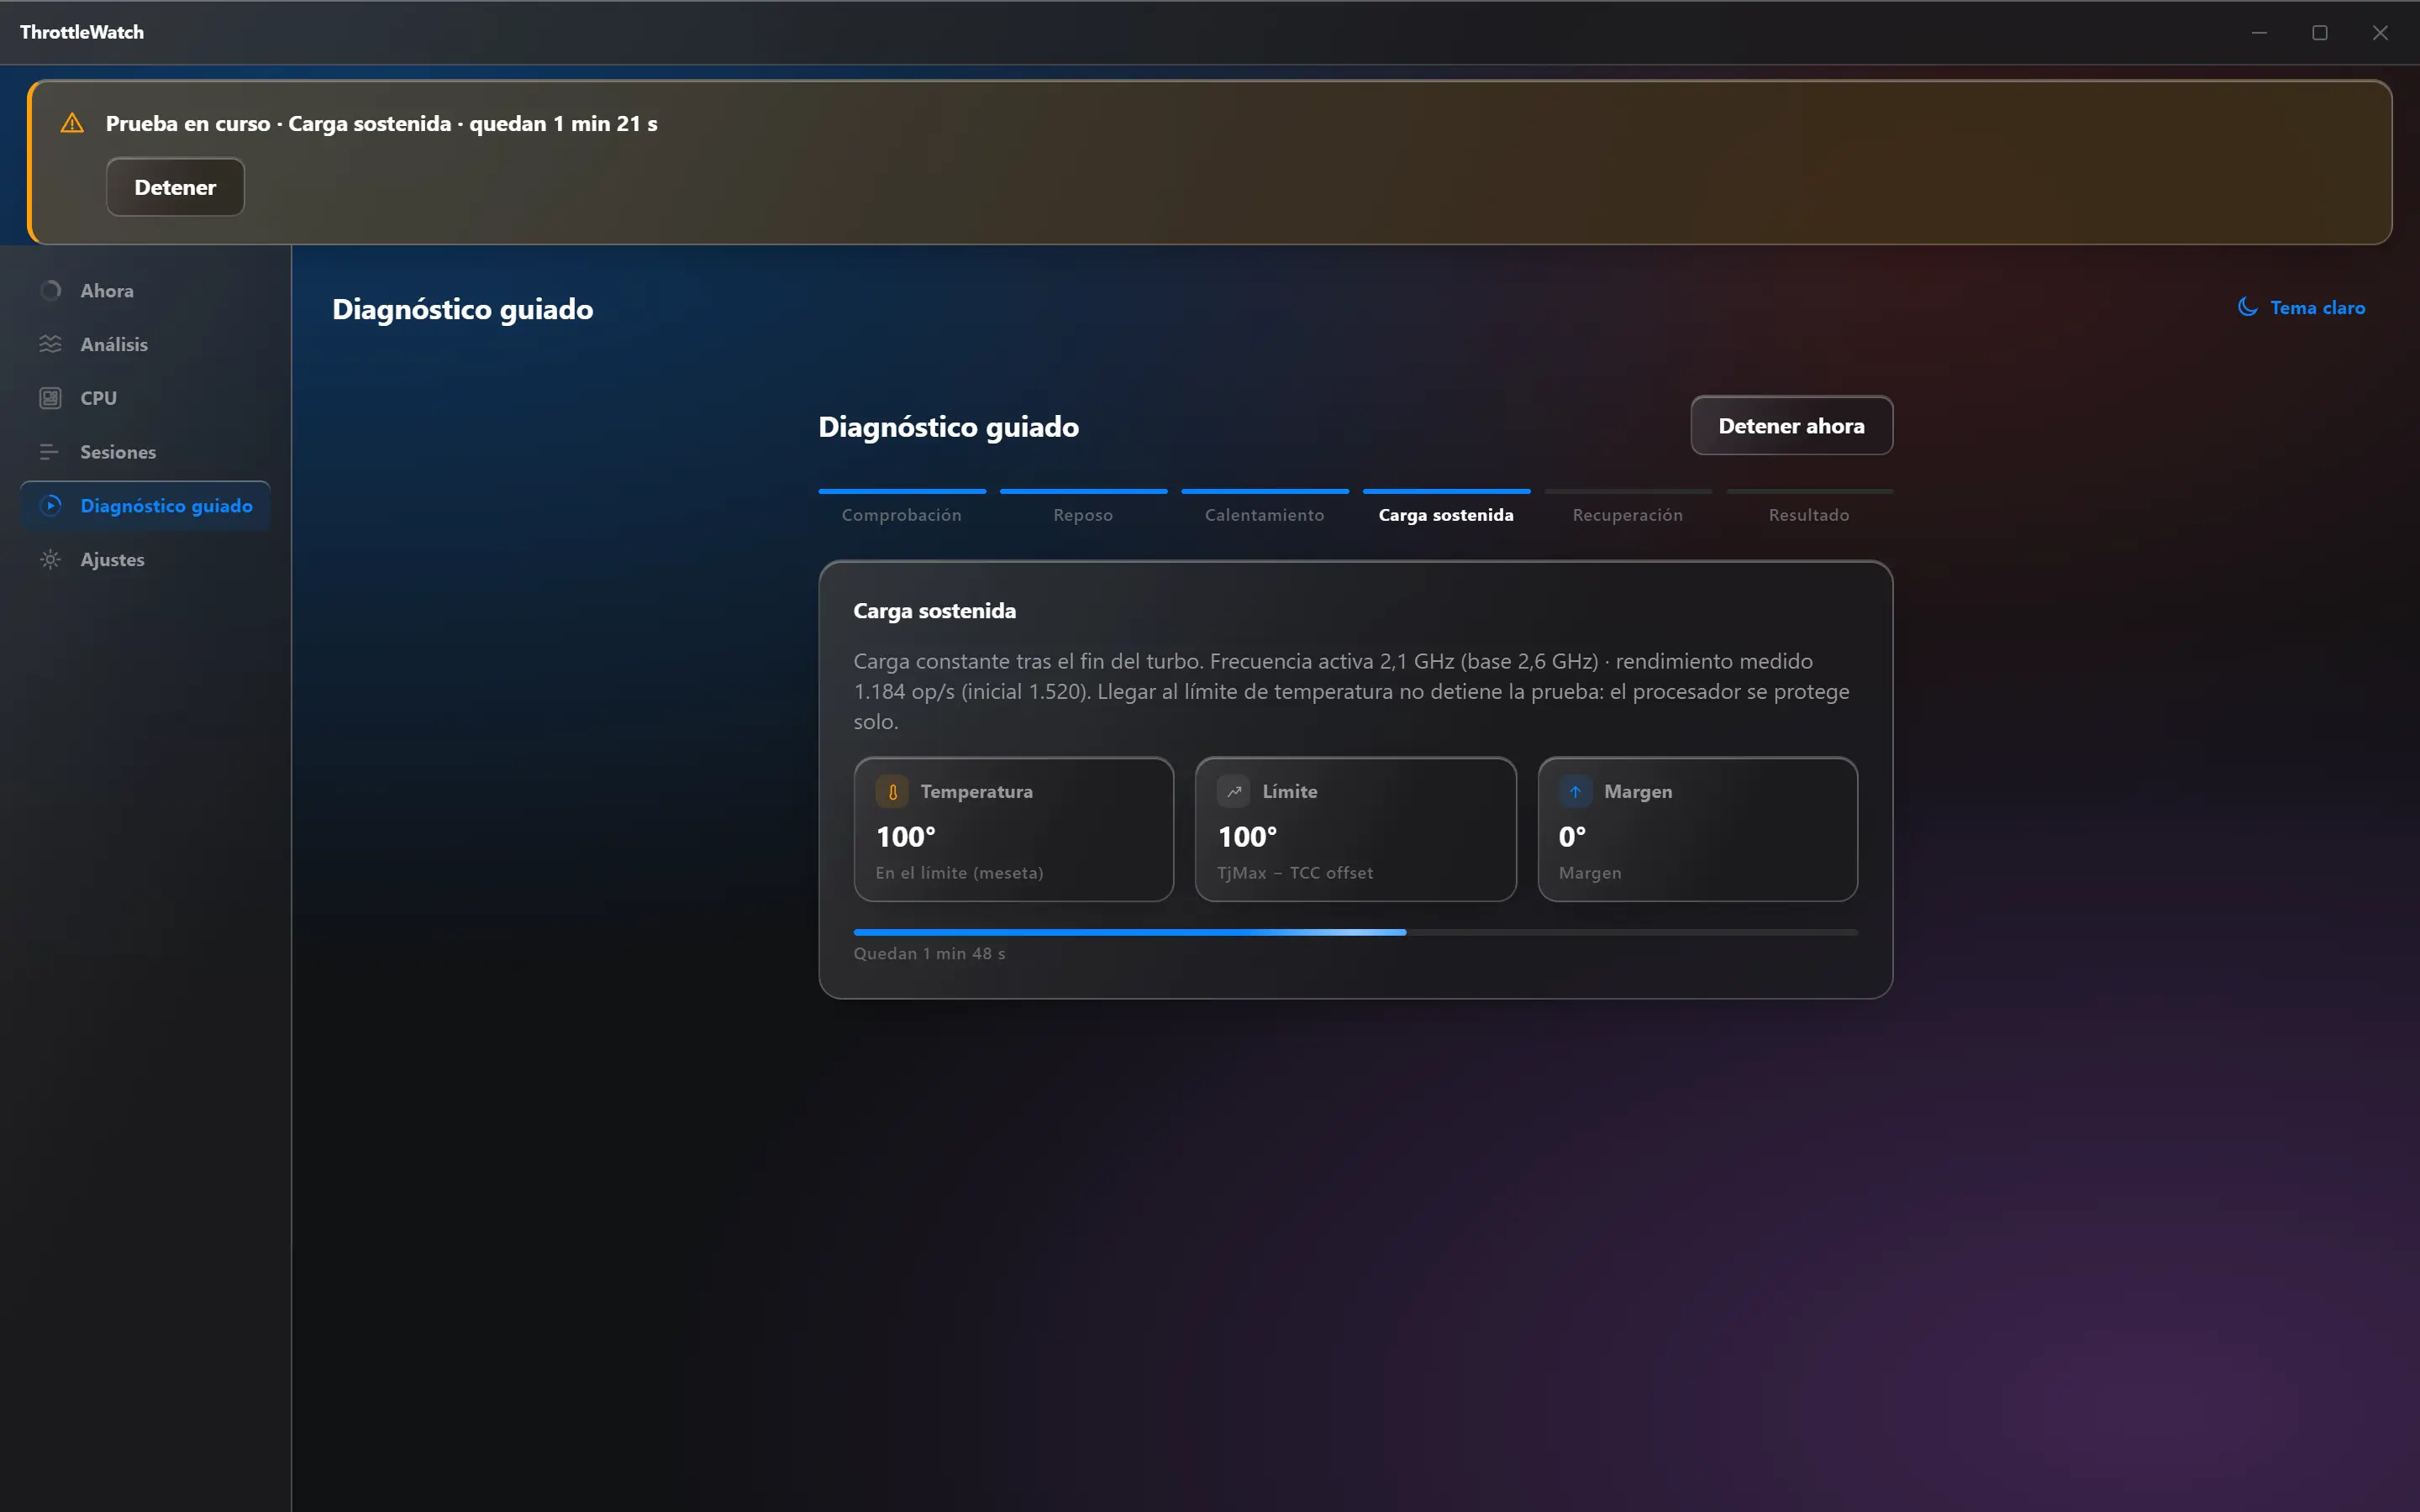
Run the guided diagnostic.
A few minutes of controlled load, with safety stops, and you can cancel at any time.
3 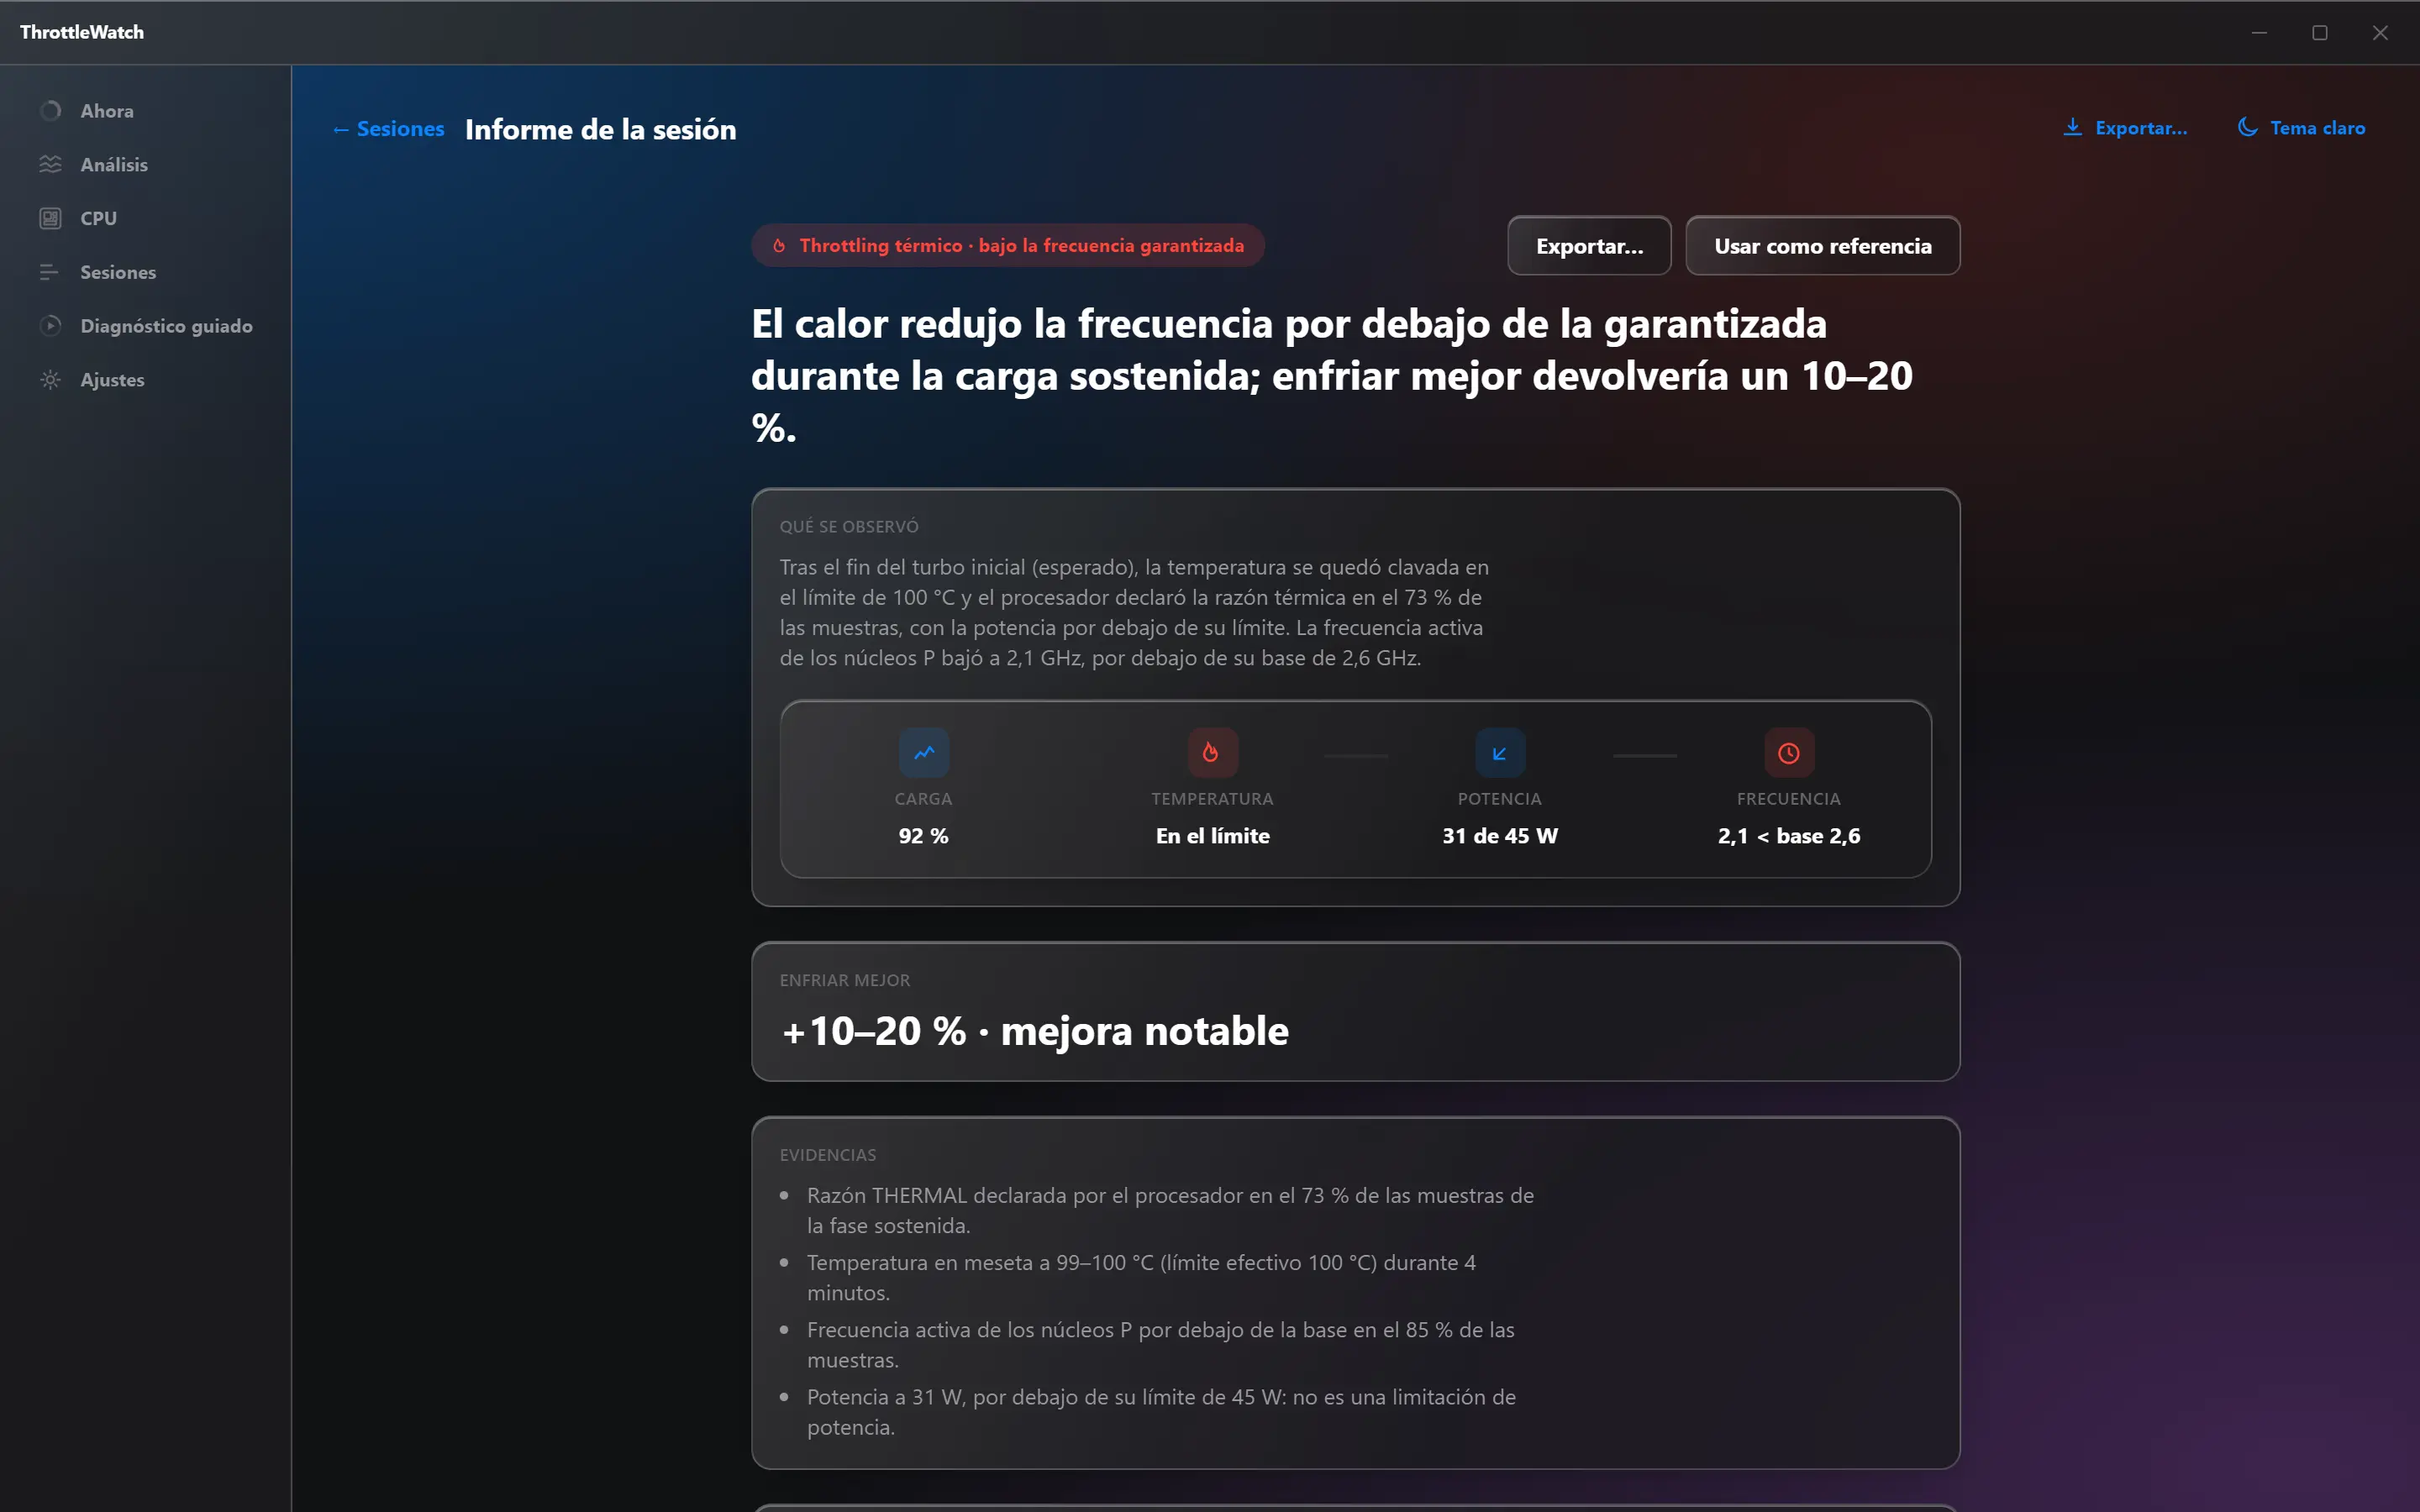
Read the verdict.
In one sentence, with evidence and an honest estimate of how much you would gain.
And if there isn't enough evidence, it says so. It never makes up a number.
The verdict
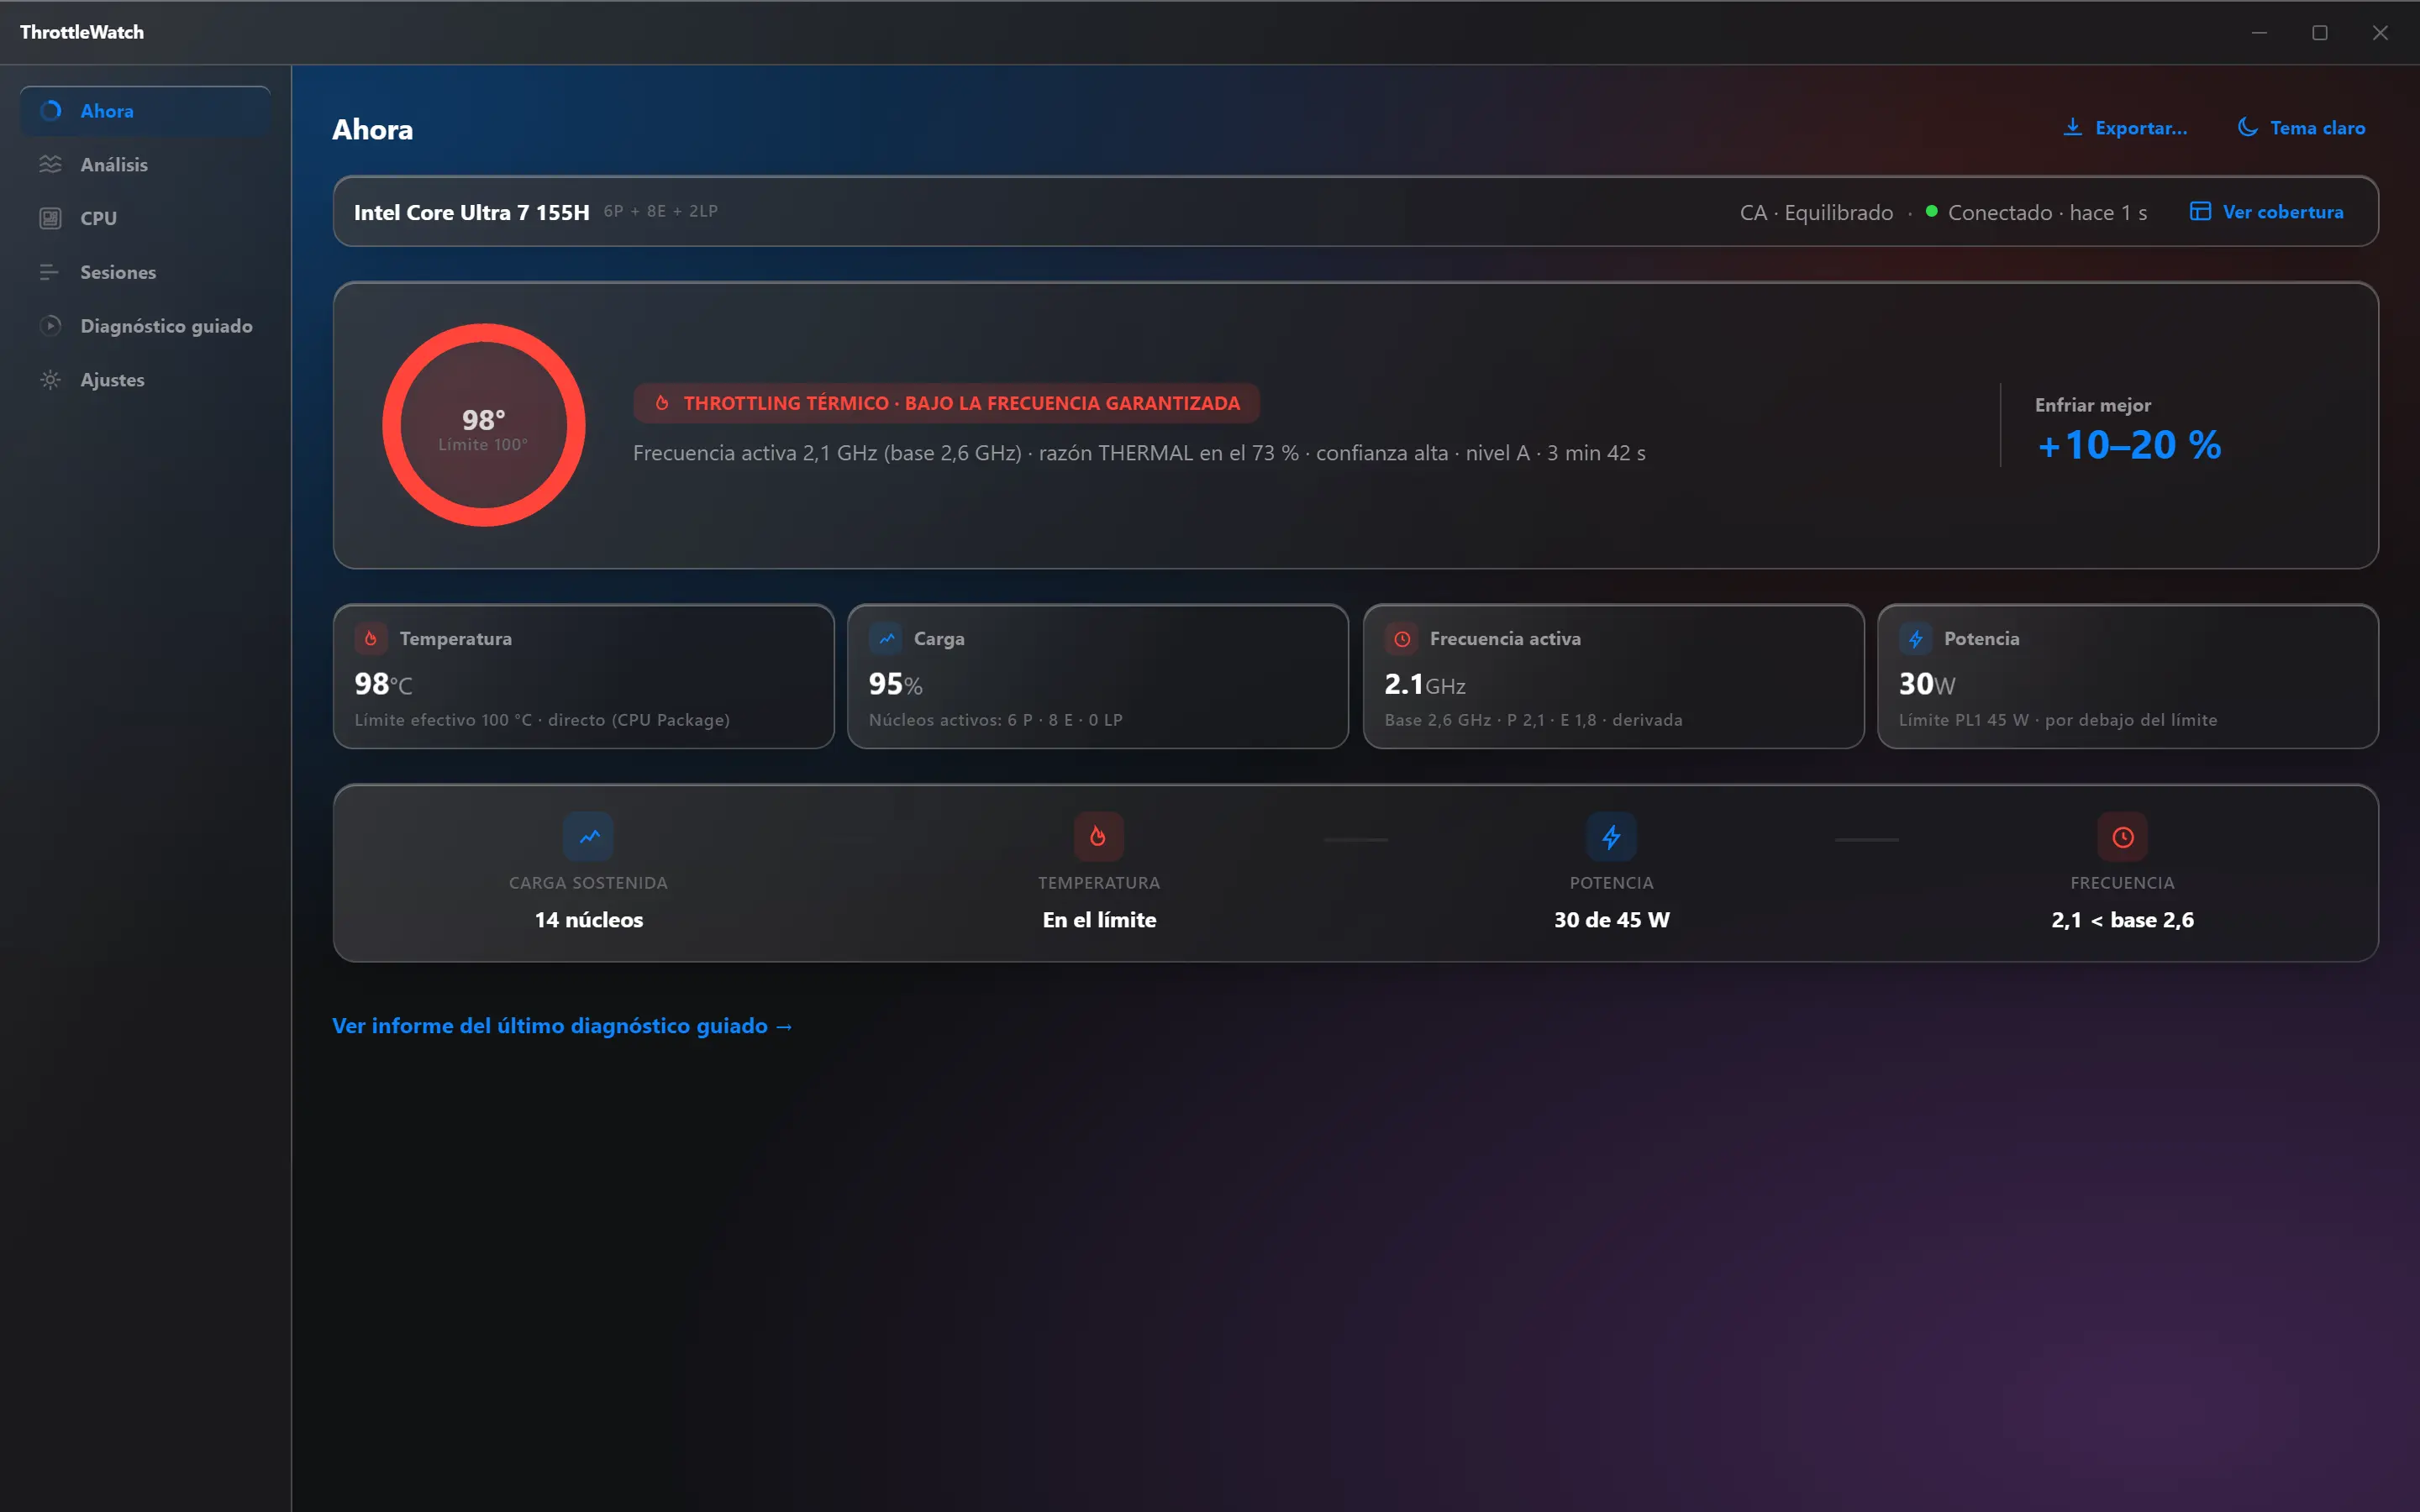
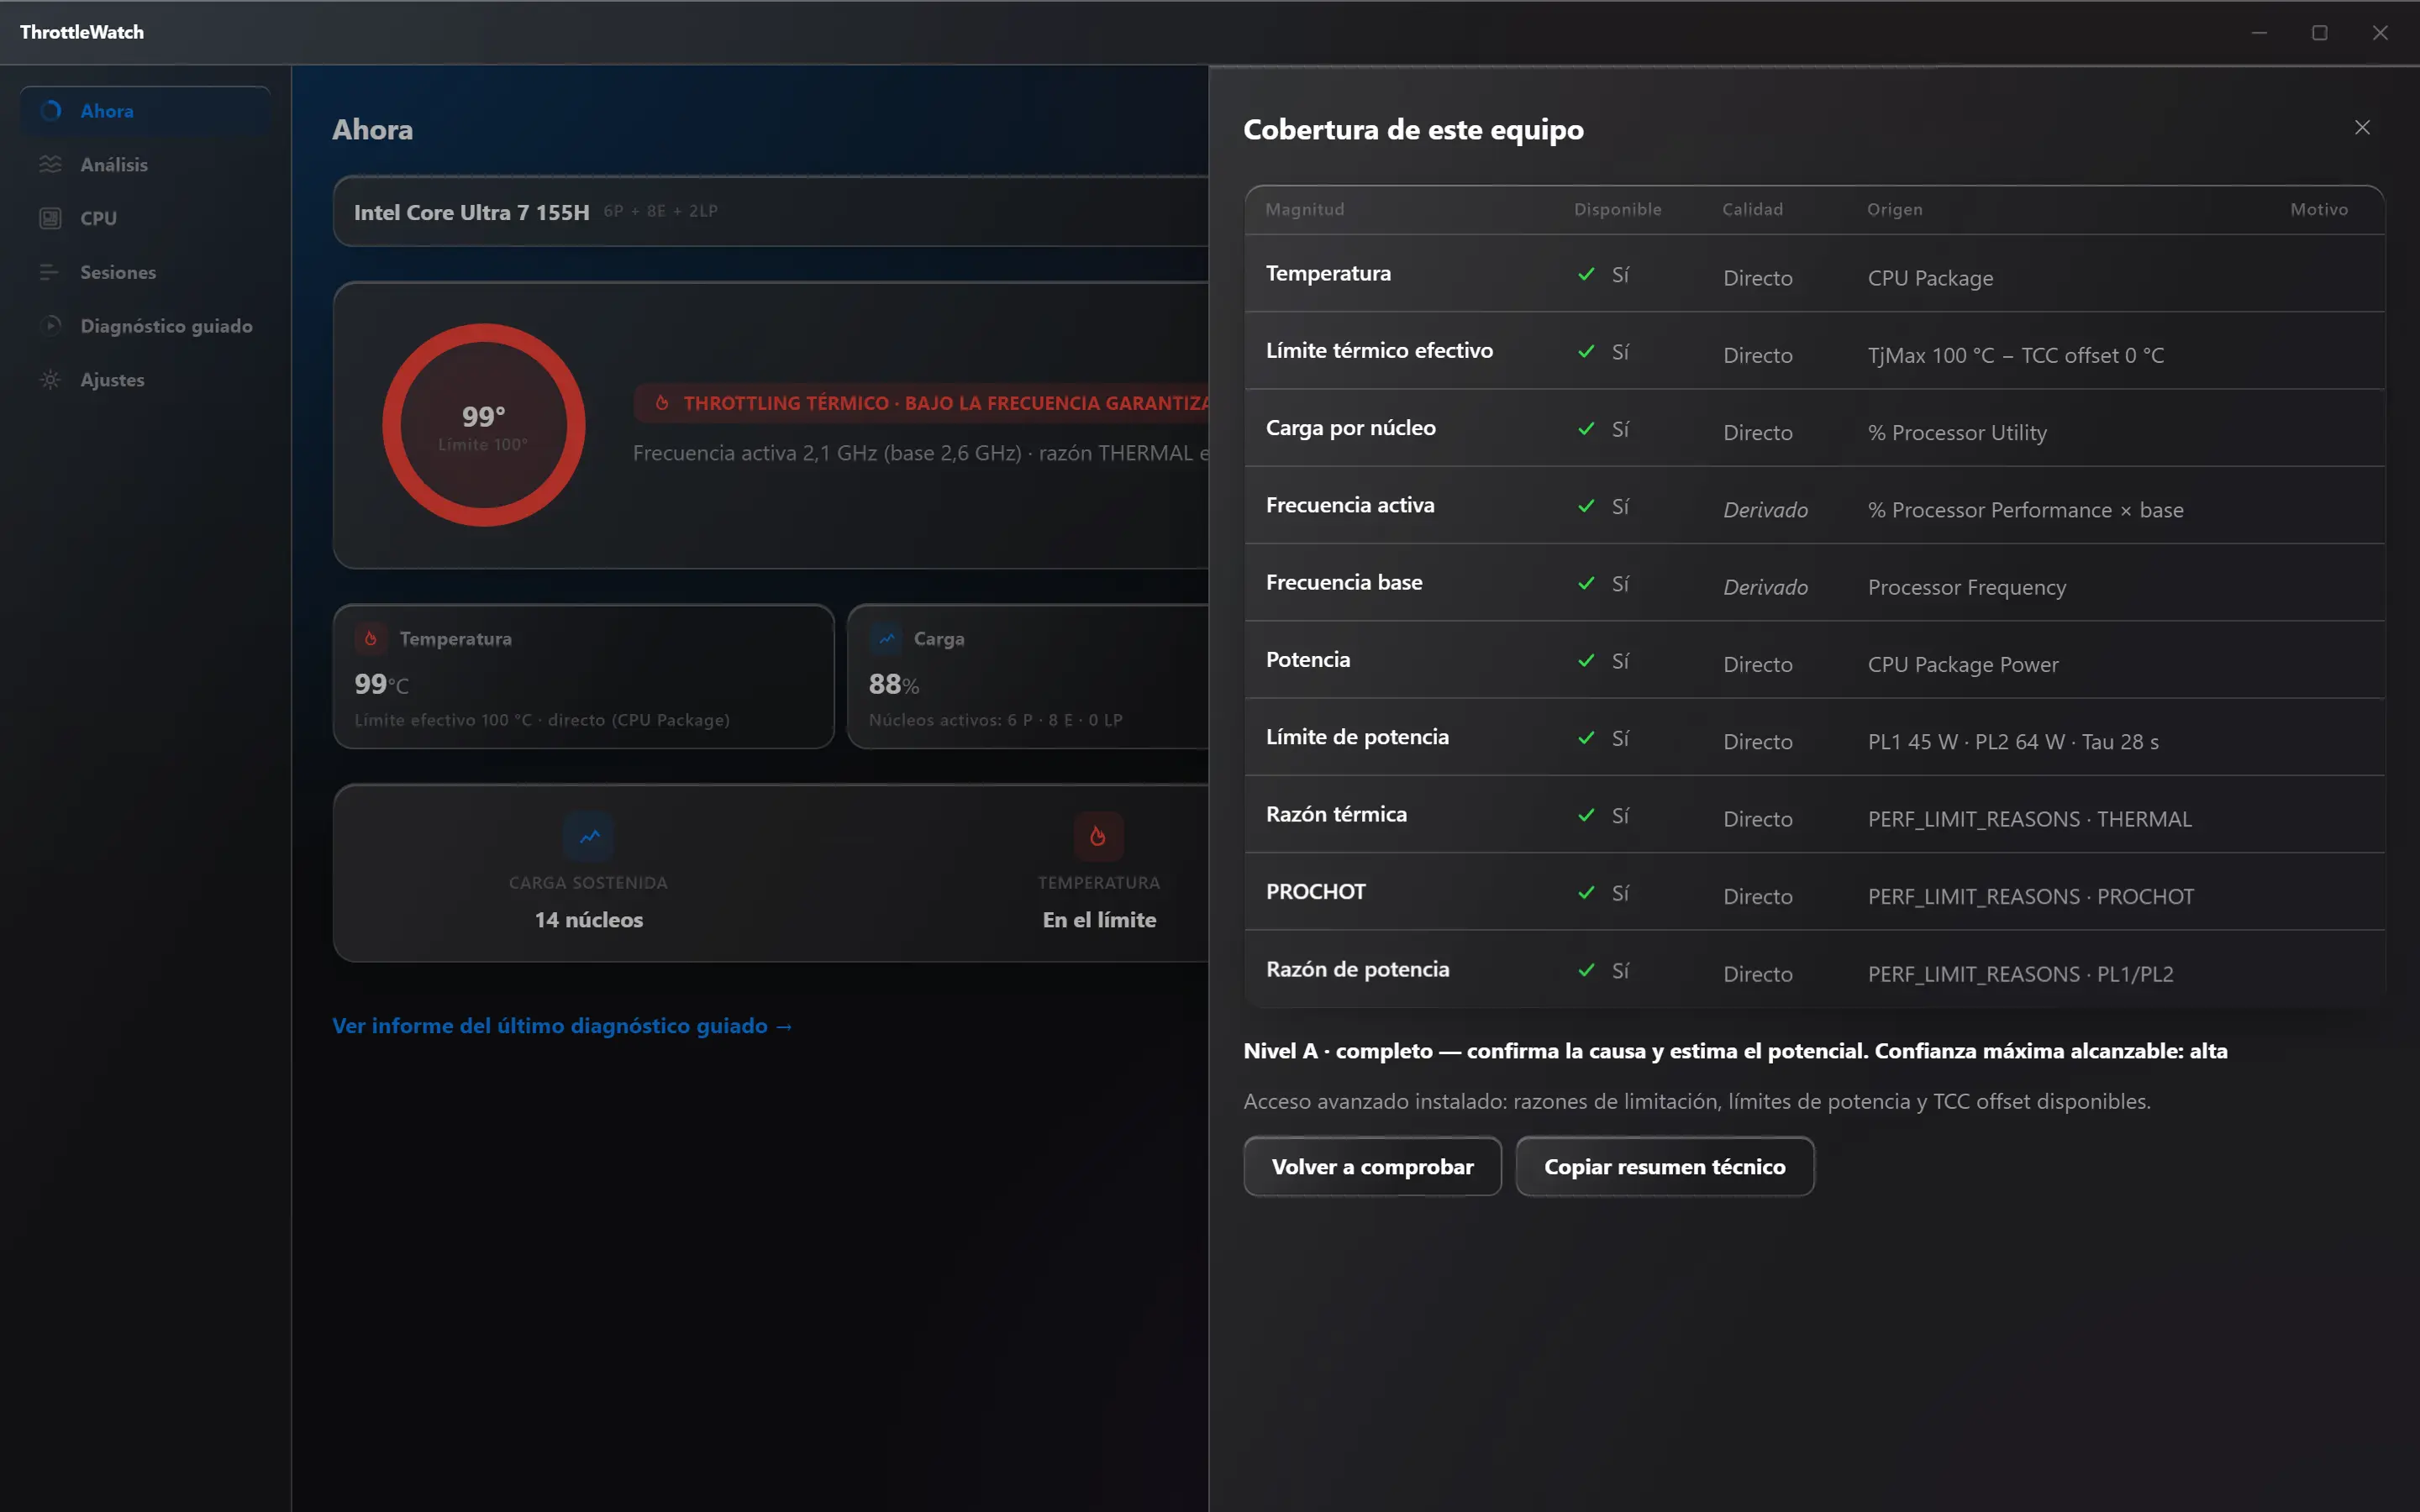
A status you can read in three seconds.
A ring, a colour and one sentence. Green, amber, red or violet: each colour means exactly one thing and is never used for anything else.
A report you can actually read.
"Heat pushed the clock below base speed during sustained load; better cooling would recover 10–20 %." That is how ThrottleWatch reports talk.
It knows what it doesn't know.
It shows which sensors your machine has, where each value comes from and how much certainty it can reach. Without advanced access it infers; with it, it confirms.
And it keeps the evidence.
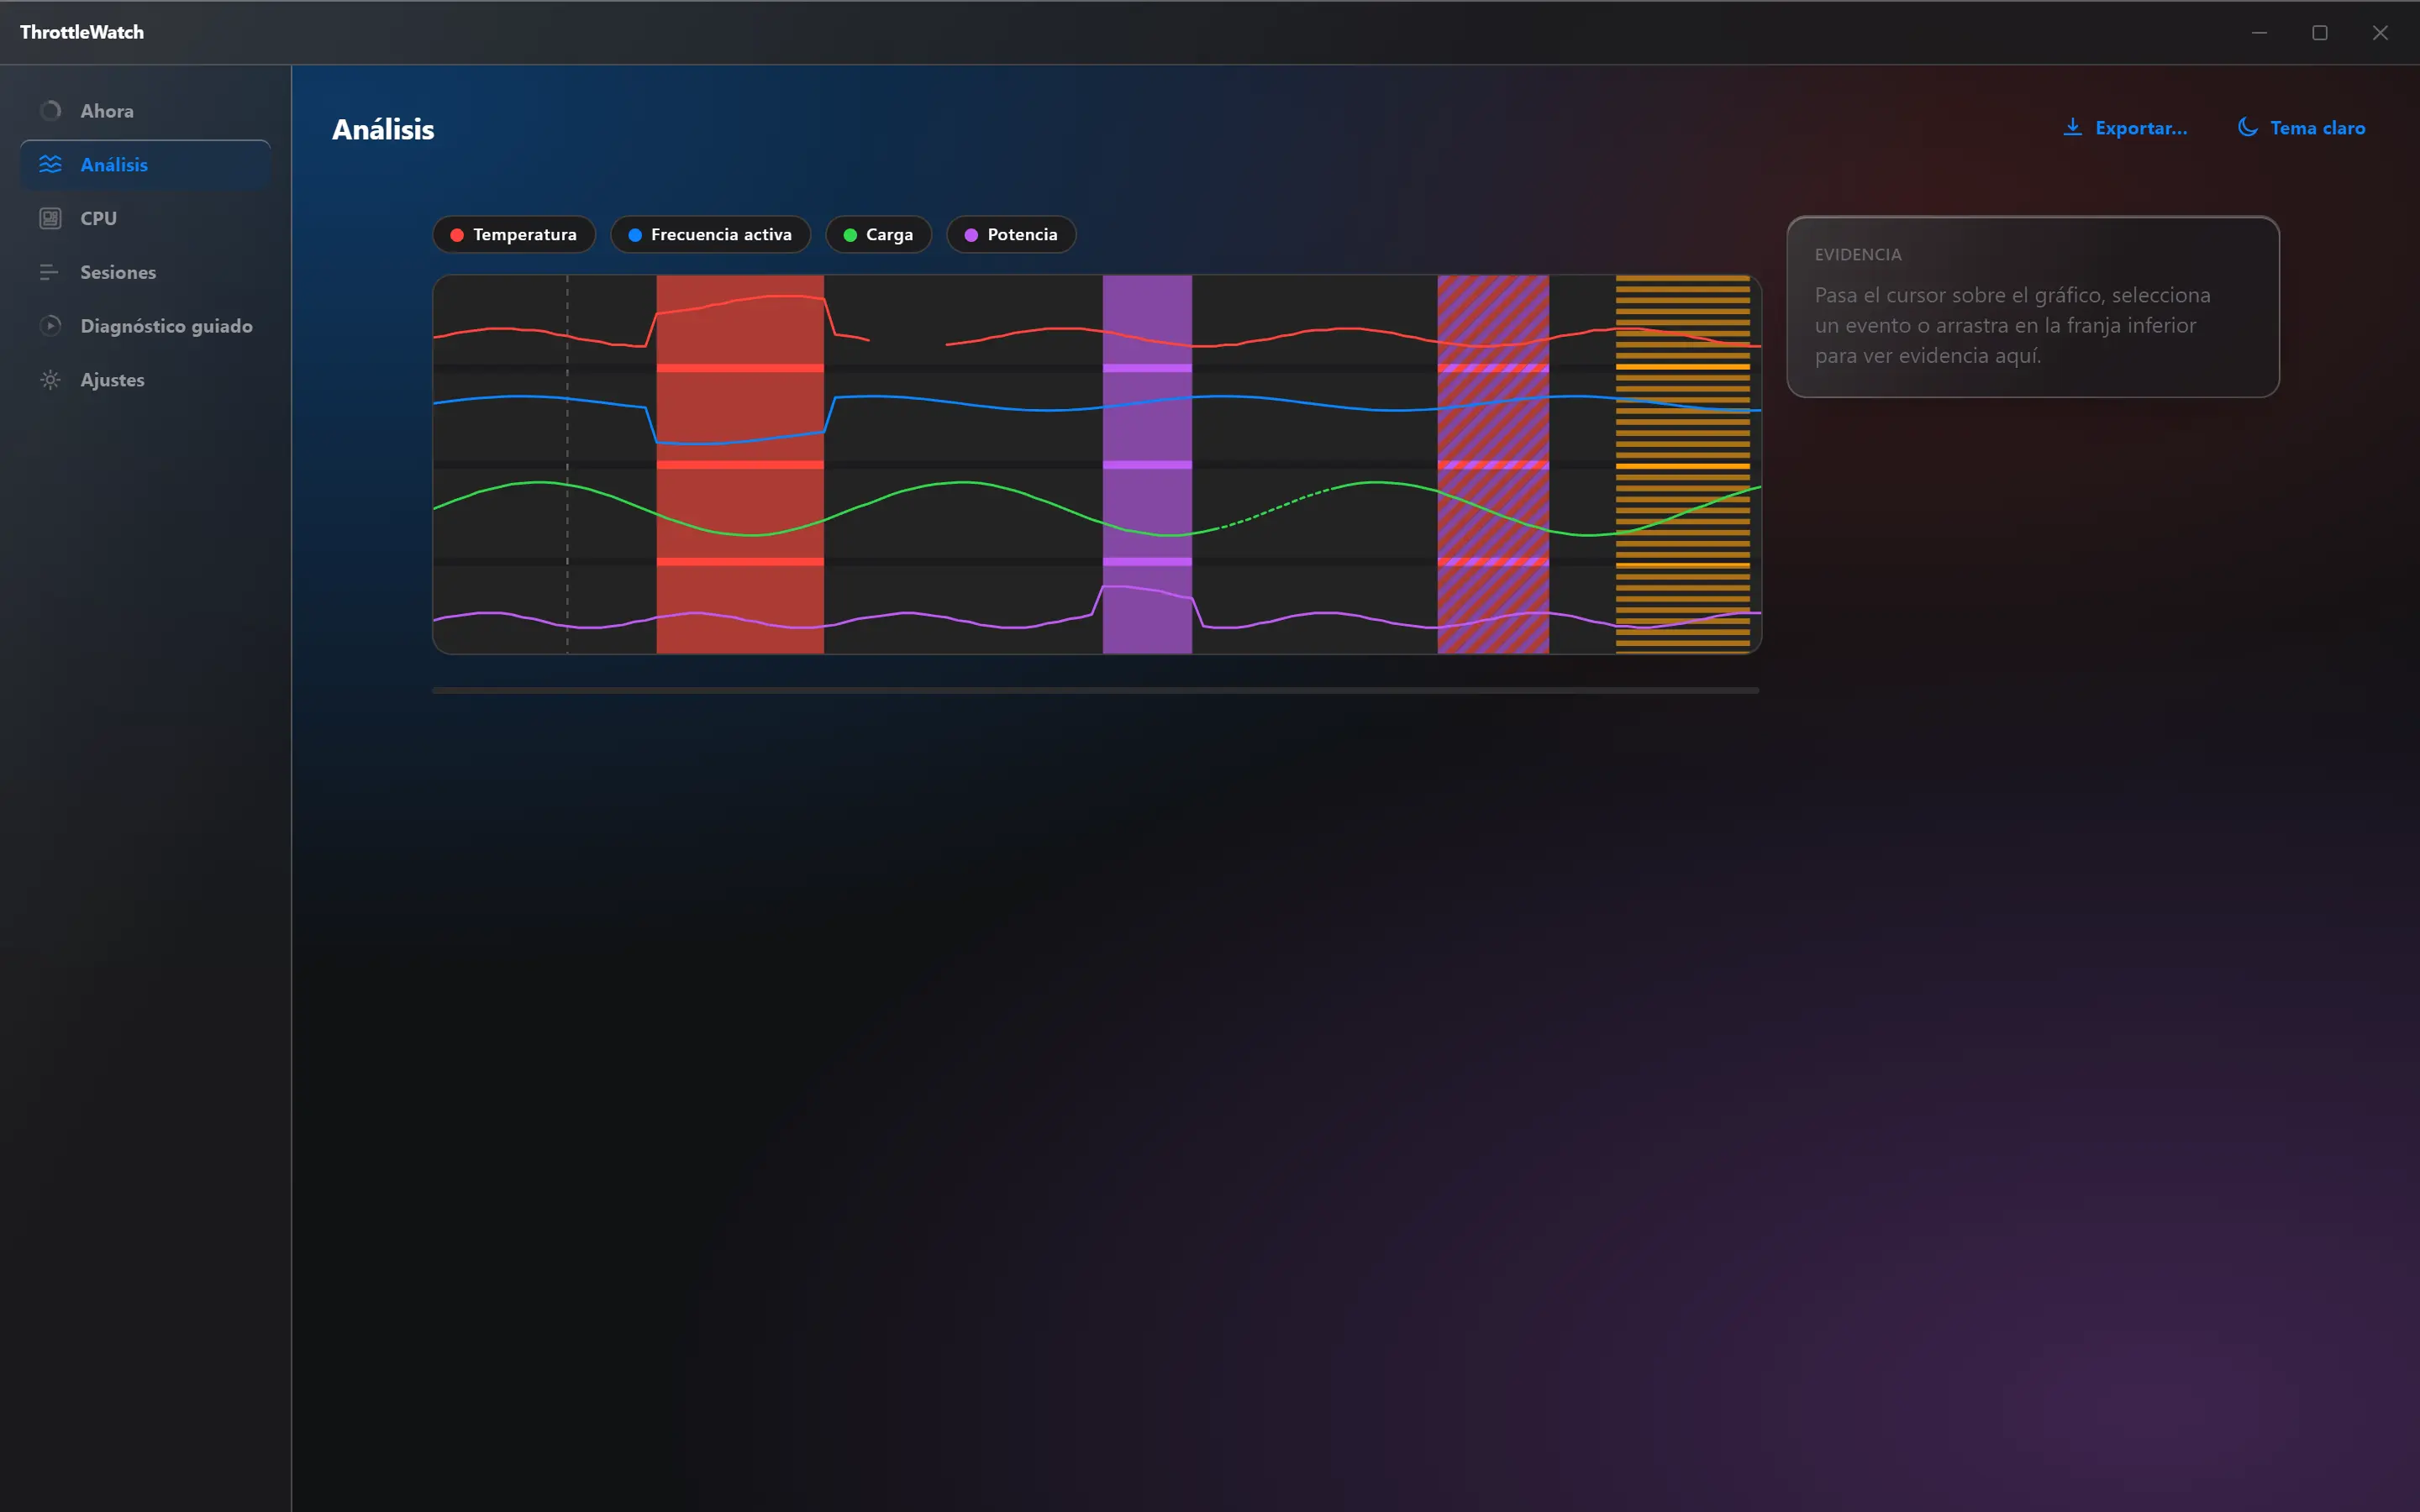
Every thermal or power event is marked on the timeline with its duration and its evidence.
When it started, how long it lasted and what caused it.
Temperature, clock speed, load and power on one synchronised chart. Coloured bands mark each episode: red when heat is in charge, violet when power is, striped when both overlap. Gaps are gaps, not zeros.
Temperature Active clock Load Power
A test that takes a few minutes, with the handbrake always in sight.
Check, idle, warm-up, sustained load, recovery, result. If temperature or headroom crosses a limit, the load stops on its own. If you want to stop, the button is always visible, on every screen.
- Automatic safety stops
- Cancel at any time
- Warns you if you're on battery or power saver
- Partial data is kept and marked as incomplete
Hot, but with no proven loss of performance.
Everything points to heat, but the machine doesn't confirm it.
The processor says so itself: it's the heat.
It has hit its electrical limit. Cooling won't change that.
The manufacturer, the charger or the battery is holding it back.
Heat and power at once; neither is singled out as the only culprit.
There isn't enough evidence. And it says exactly that.
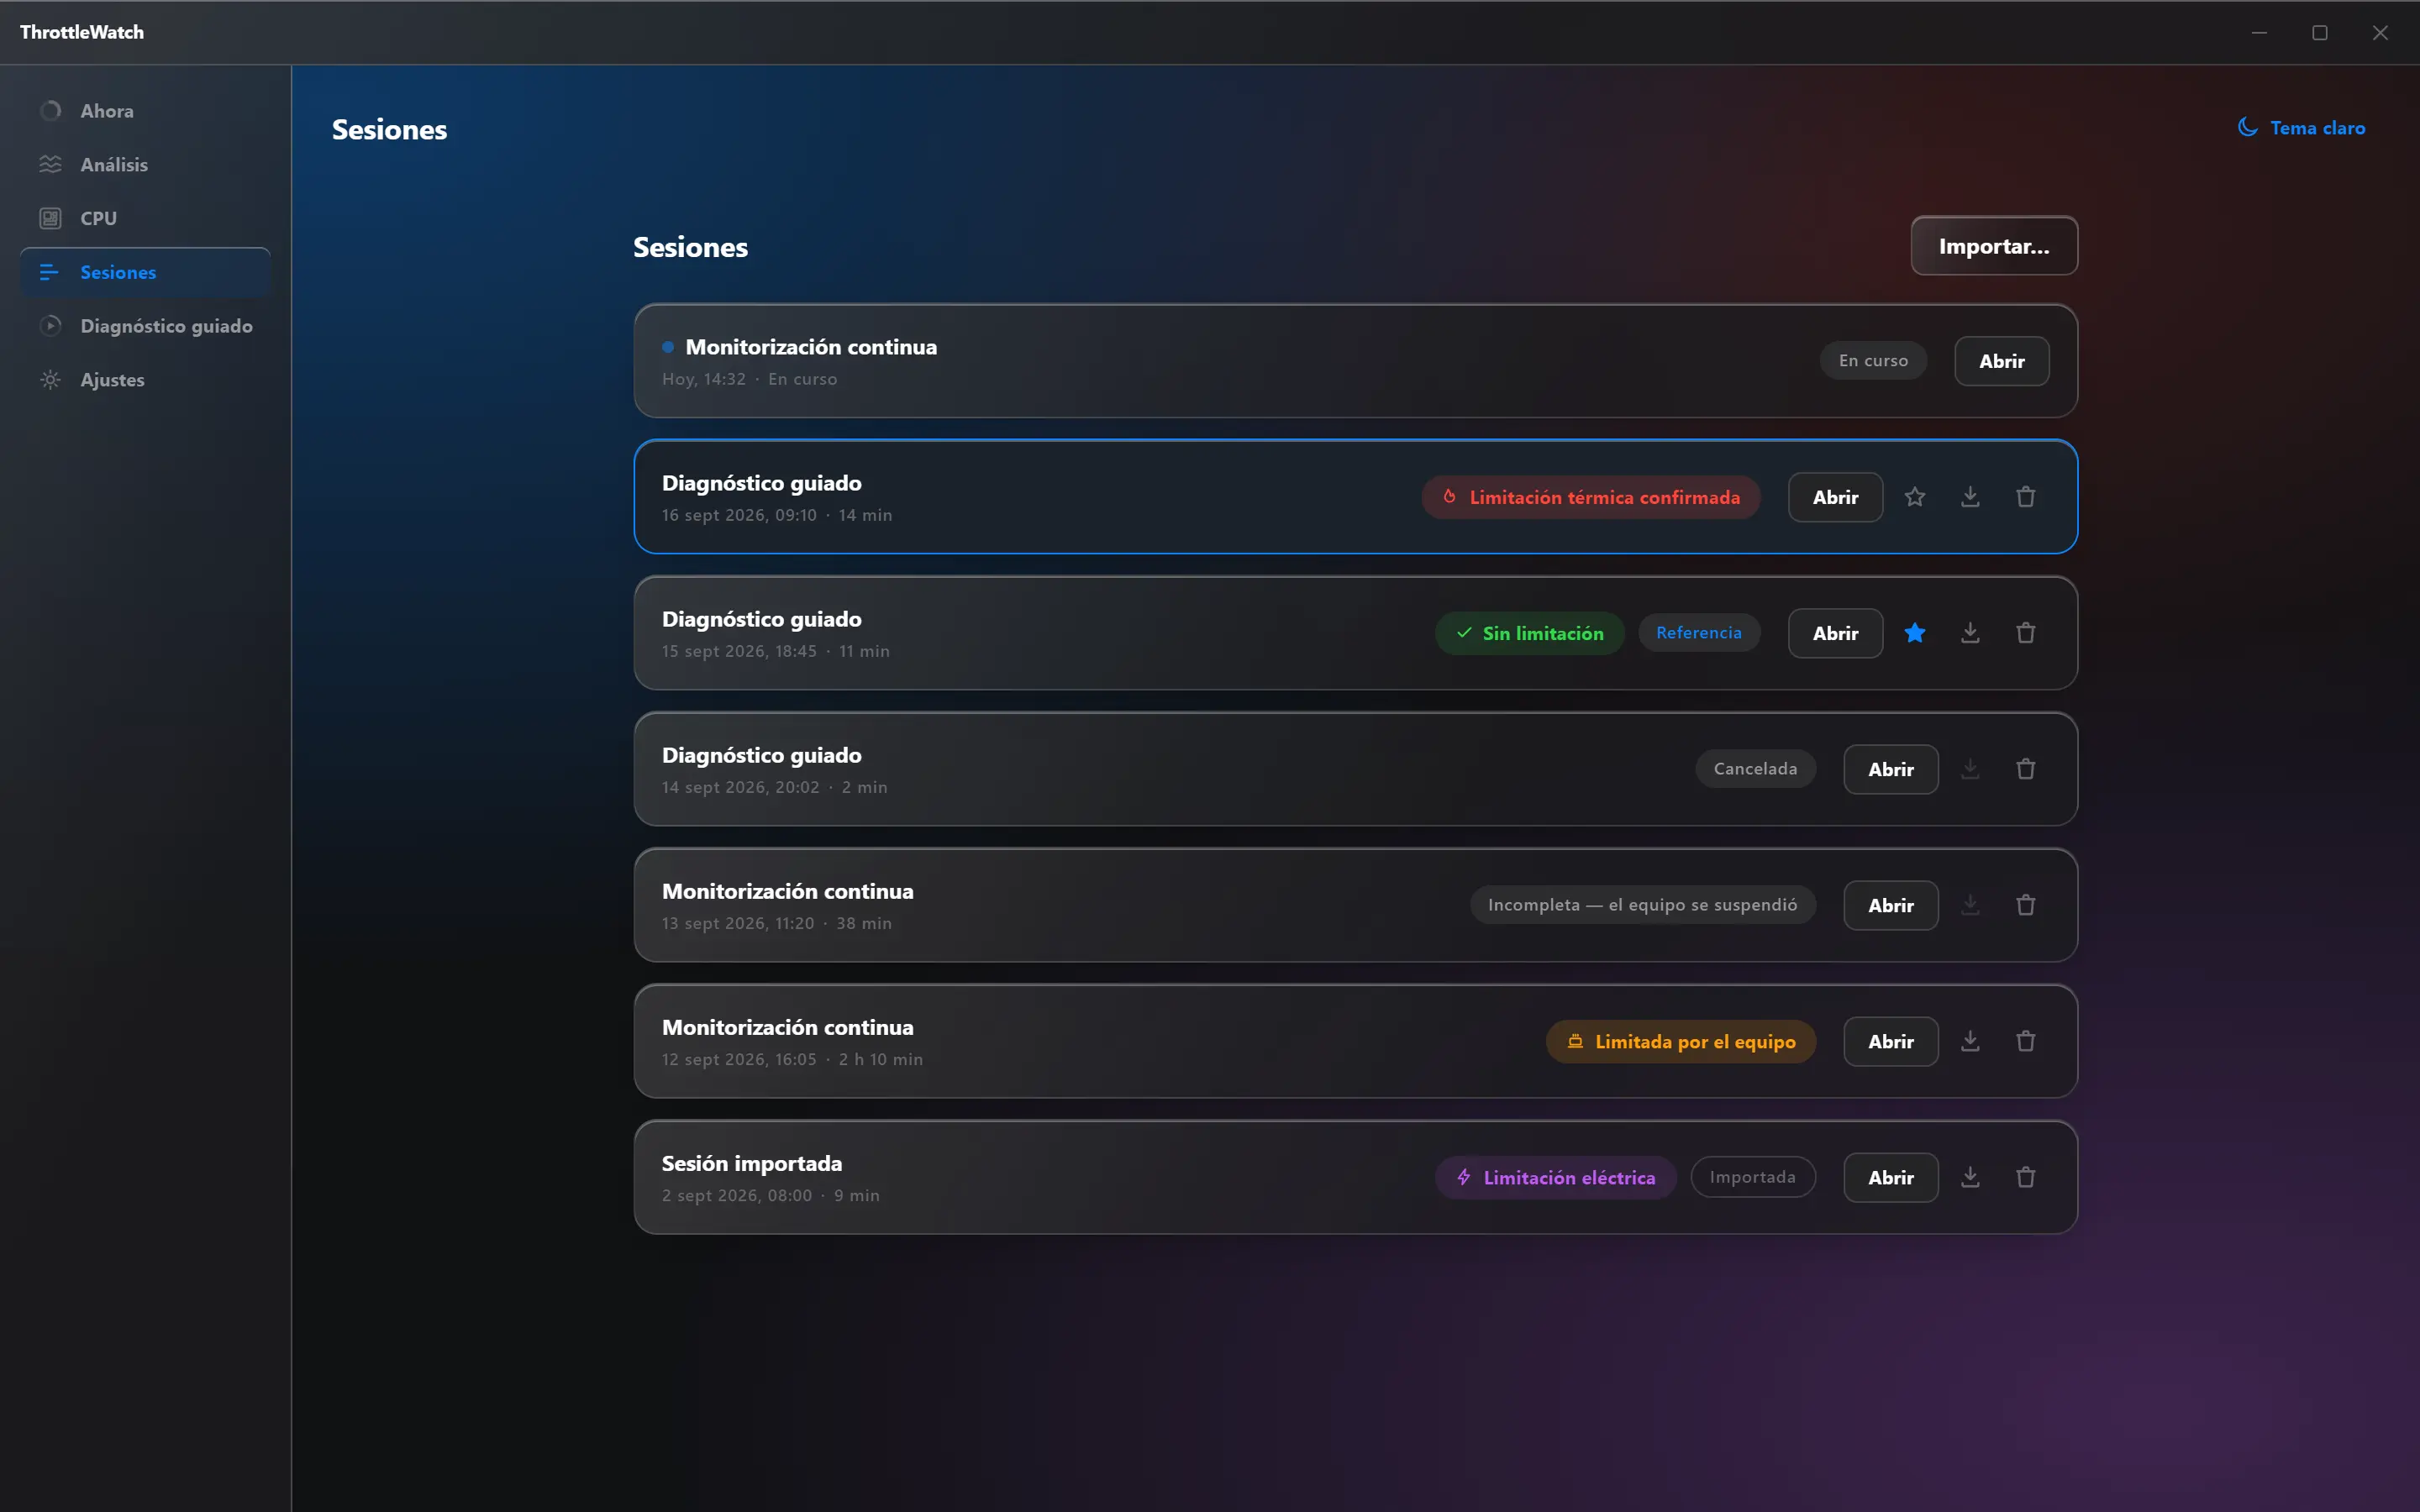
Every session keeps its verdict. Compare before and after cleaning, replacing the thermal paste or using a cooling pad.
Nothing leaves your PC. Literally.
No account, no cloud, no telemetry, not even anonymous. ThrottleWatch works completely offline. The only possible network access is the updater, which is off by default and only installs signed releases.
- Data stored only in your Windows profile
- Kept for 7 days by default, configurable (session only, 1, 7 or 30 days)
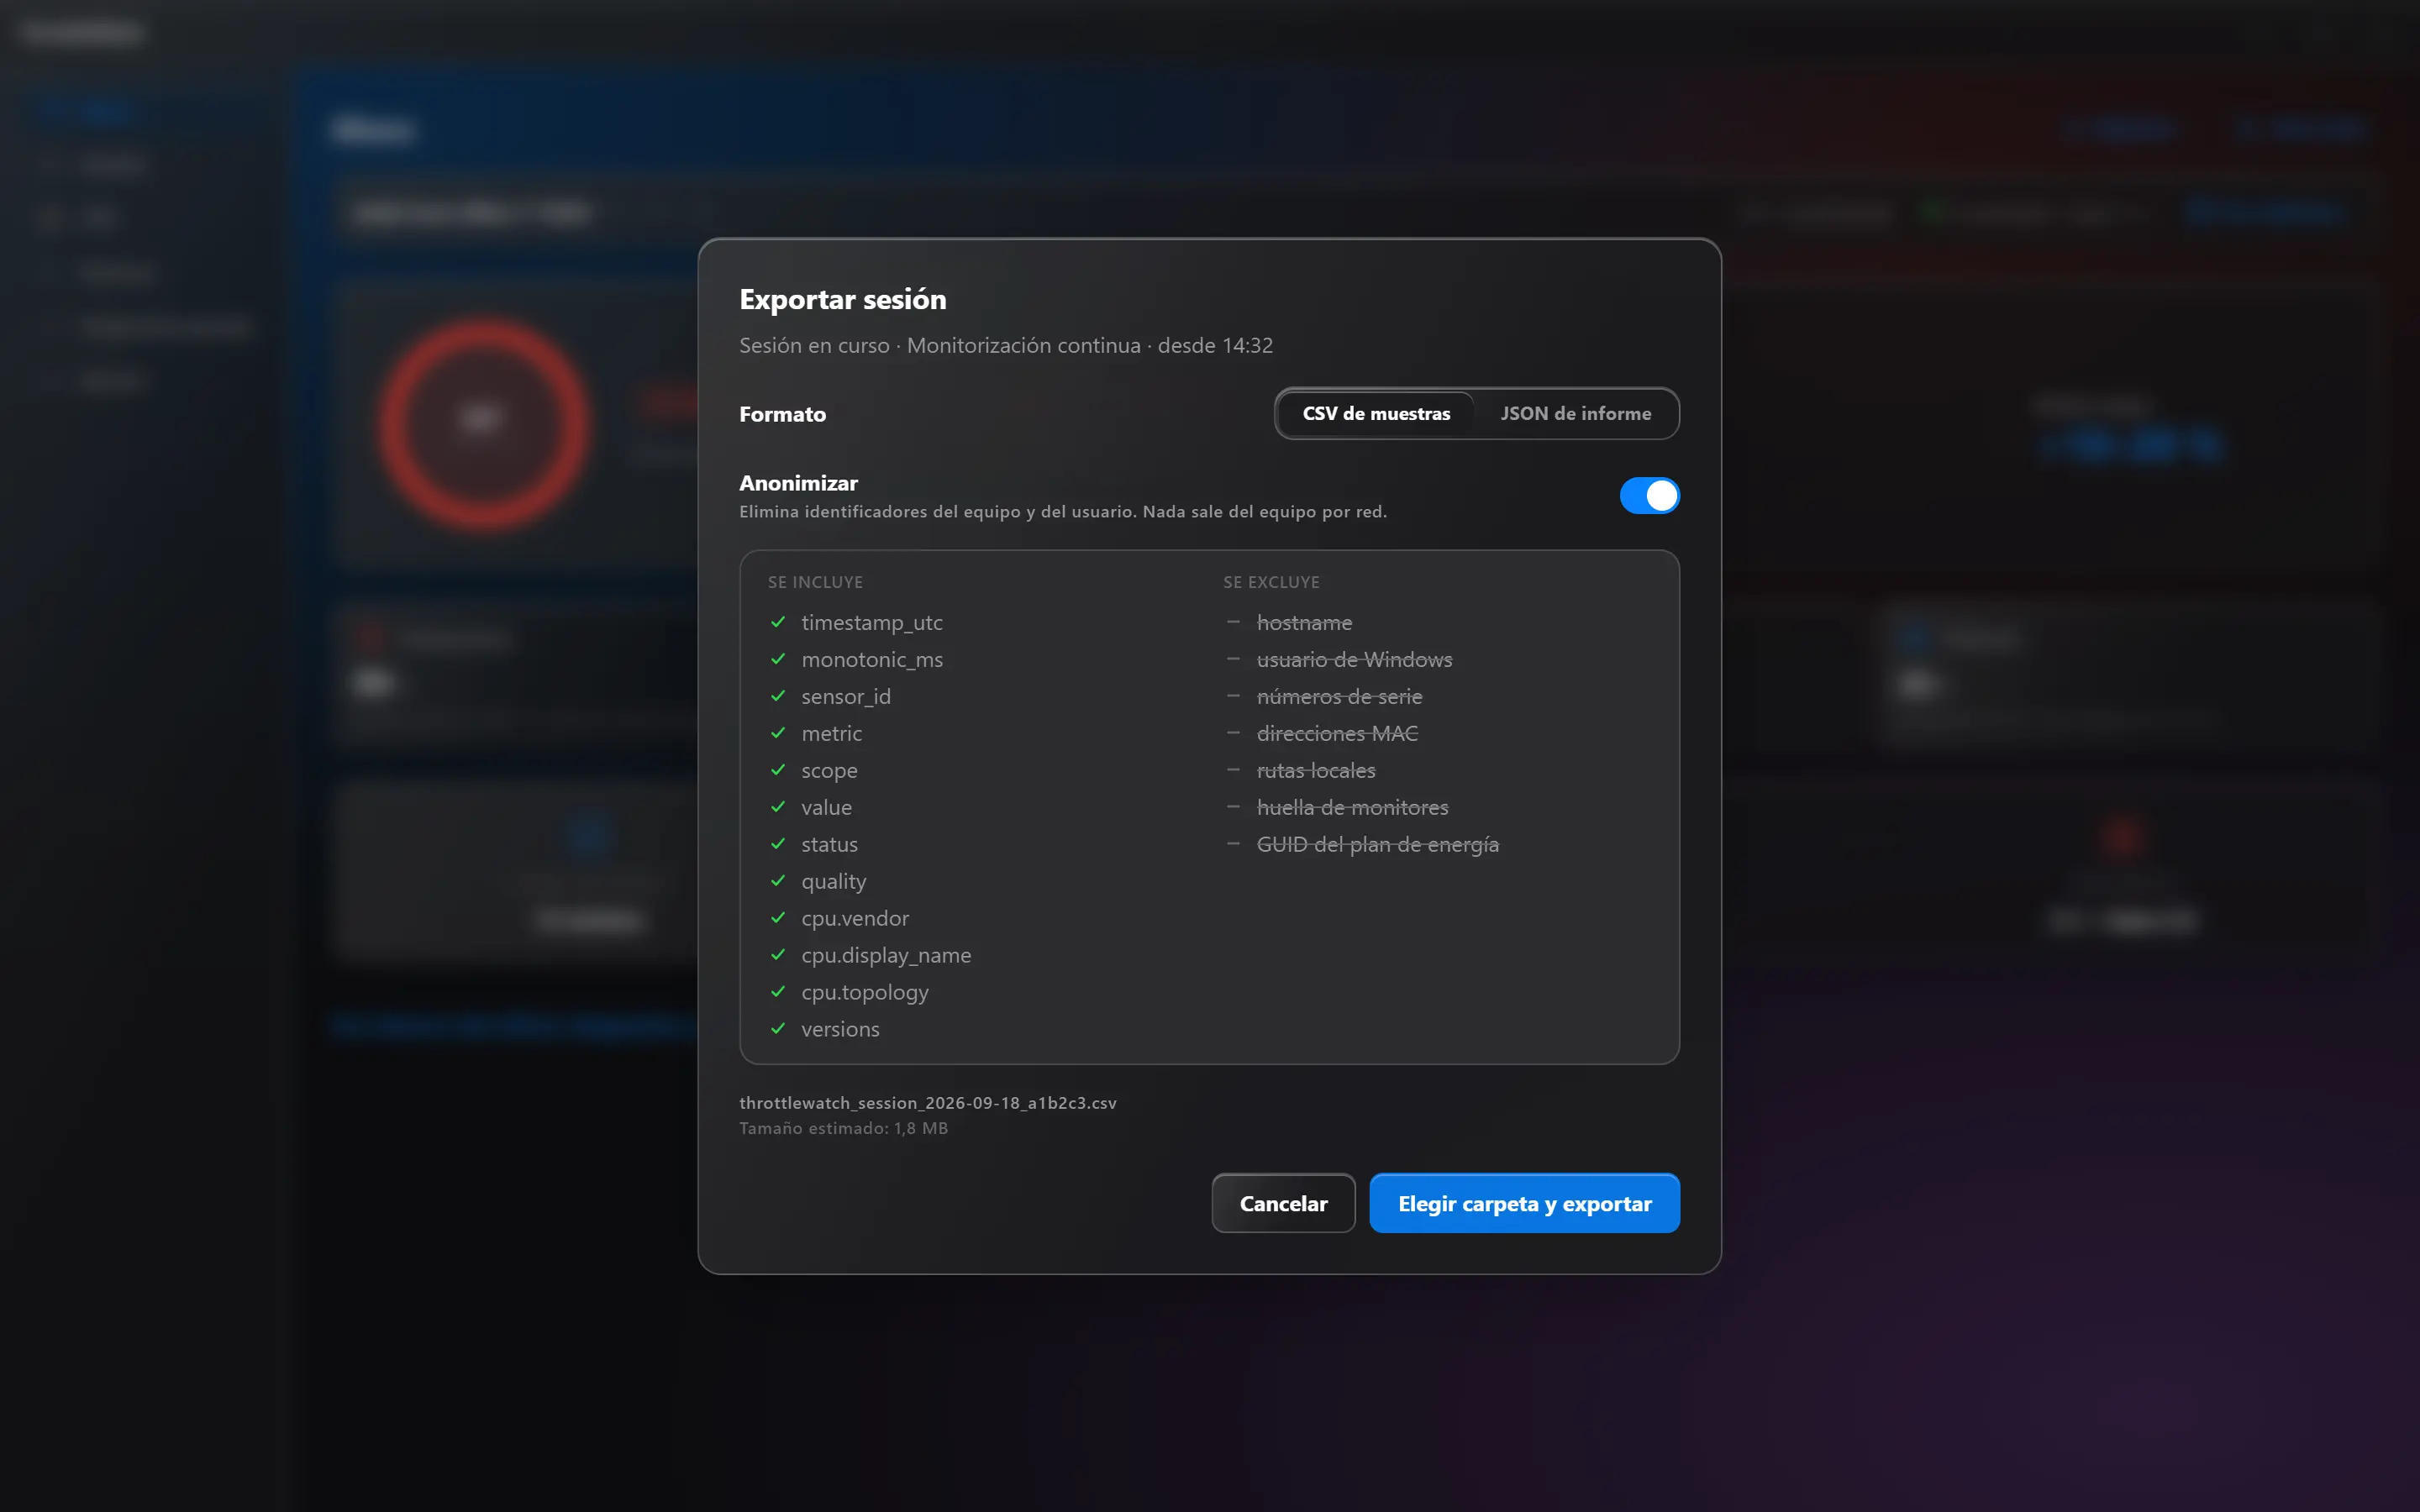
- Anonymised export: no computer name, user, serial numbers or paths
- Delete everything or reset with one click
Never leaves your PC:
hostname Windows user serial numbers MAC addresses local paths power plan GUID
It feels like Windows because it's made for Windows.
Light and dark themes that follow the system, a window that remembers where you left it, optional tray icon, optional start with Windows, full keyboard support, screen readers, reduced motion. English and Spanish.
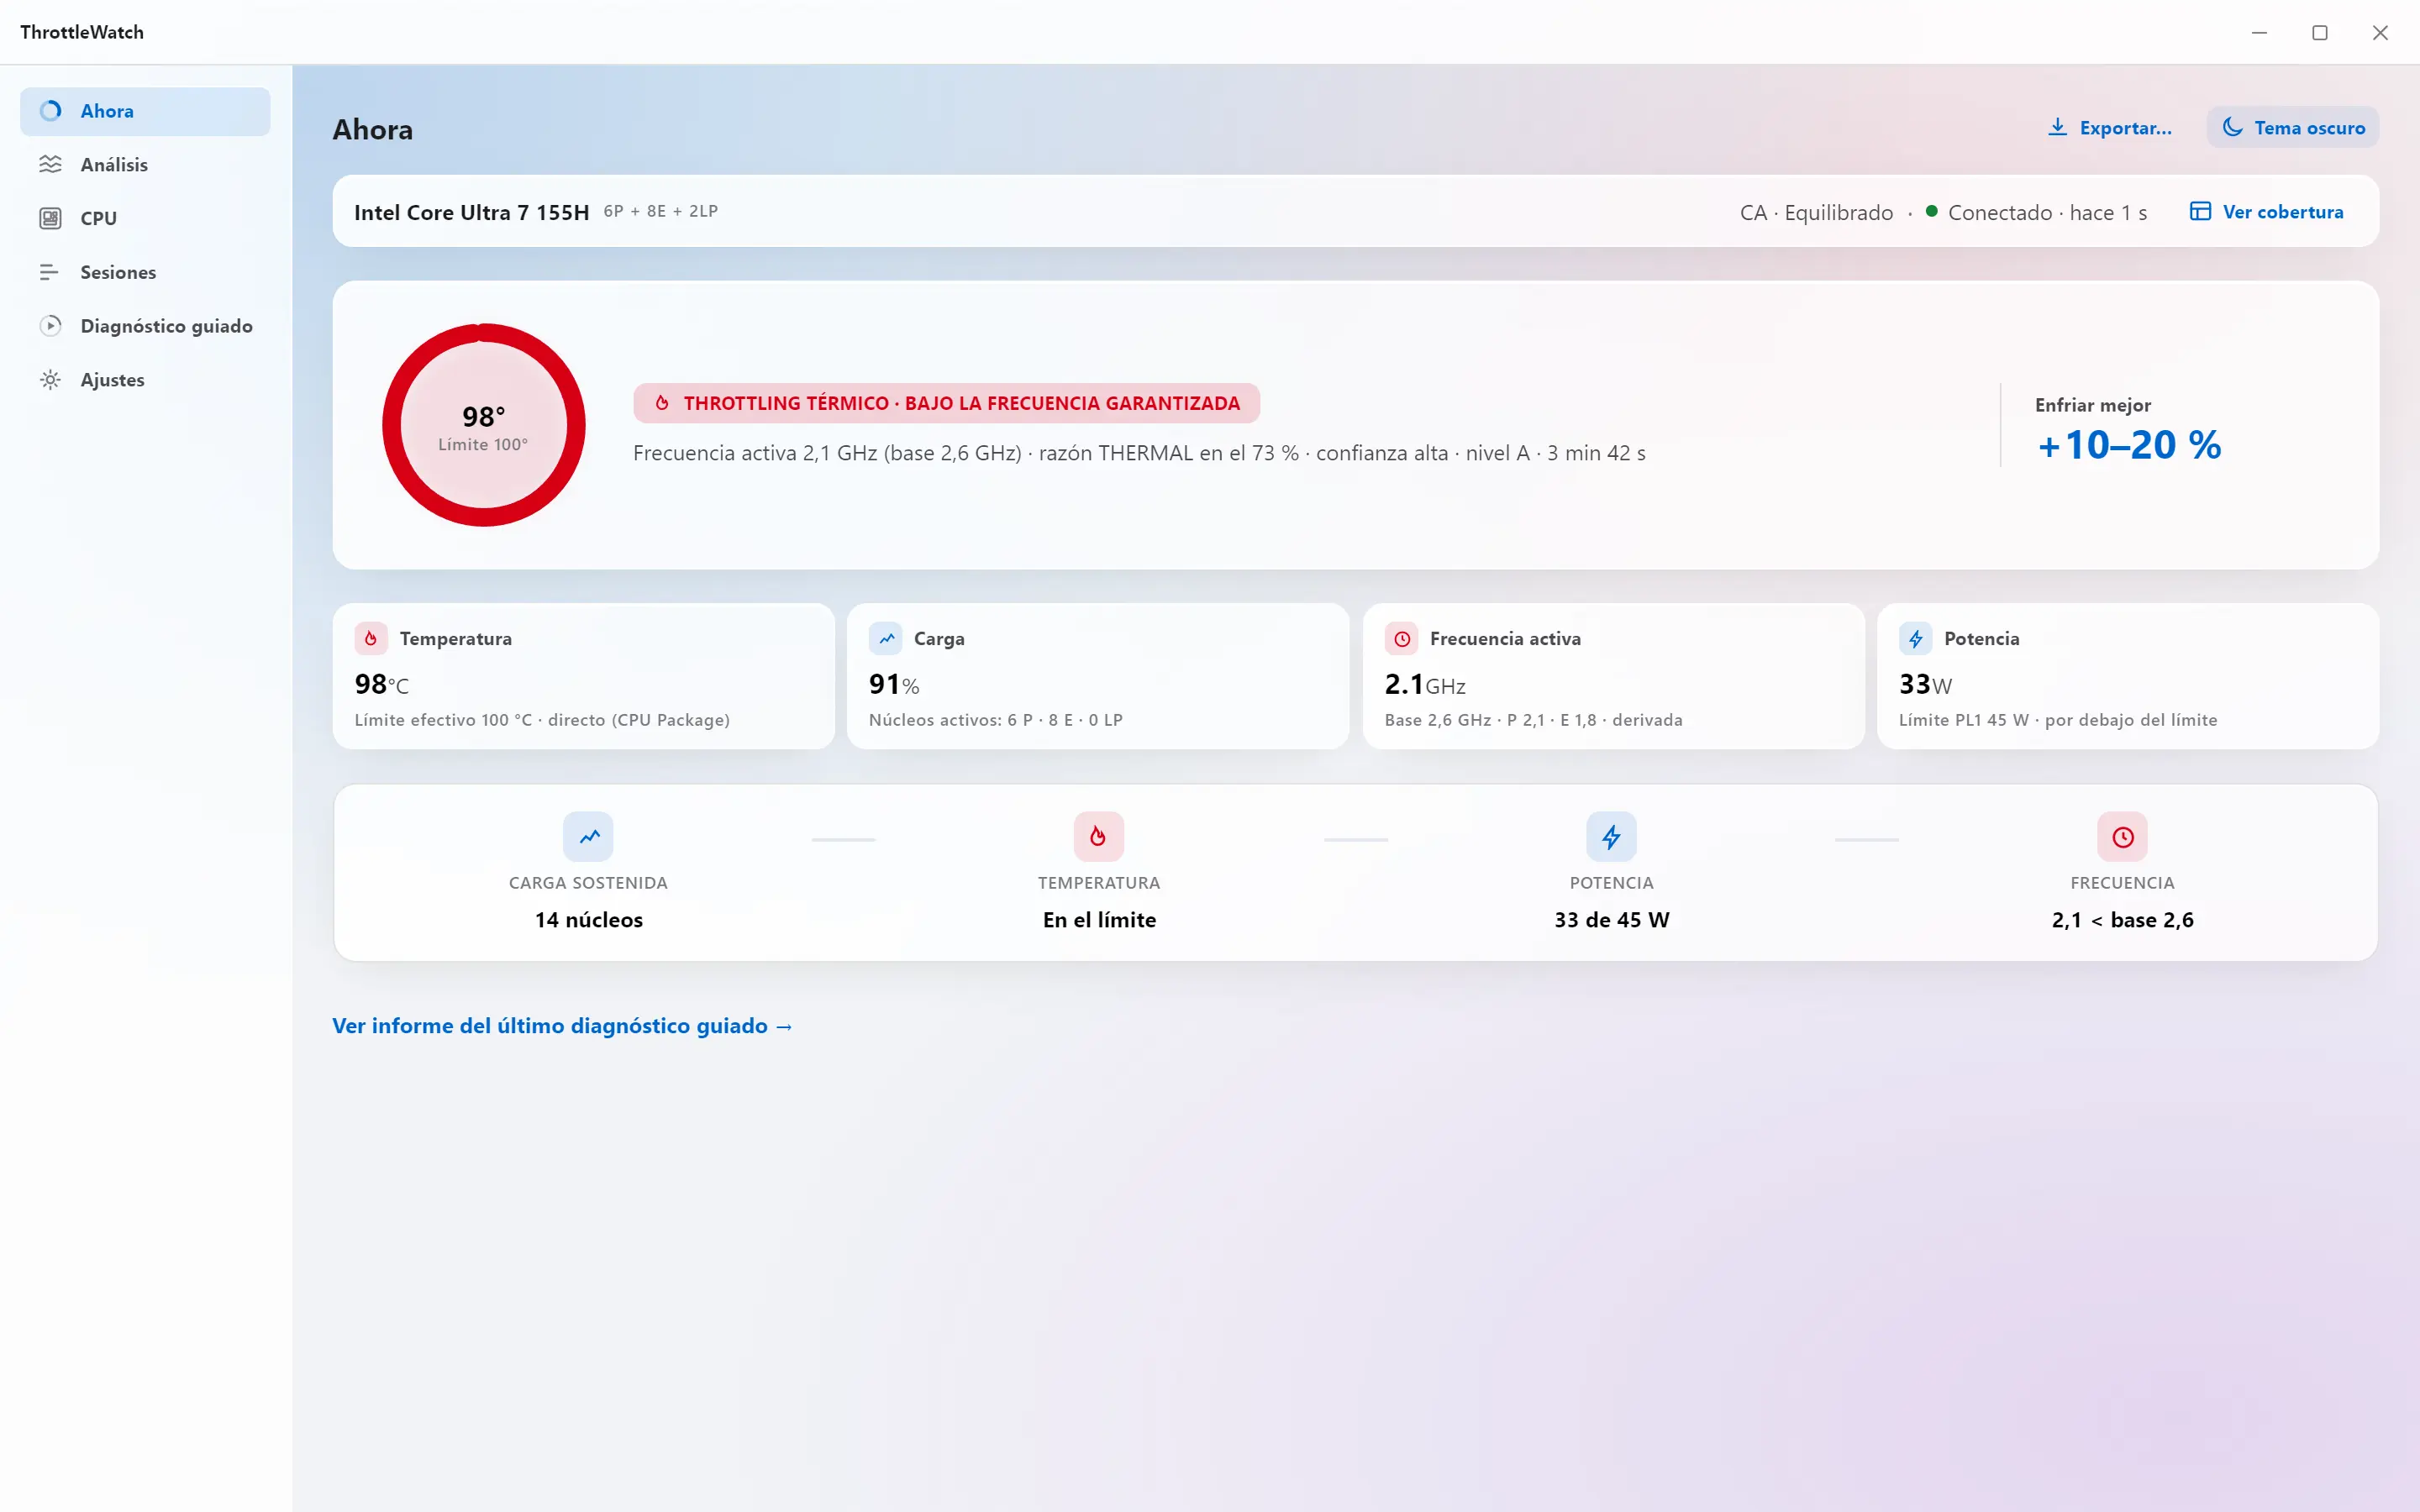
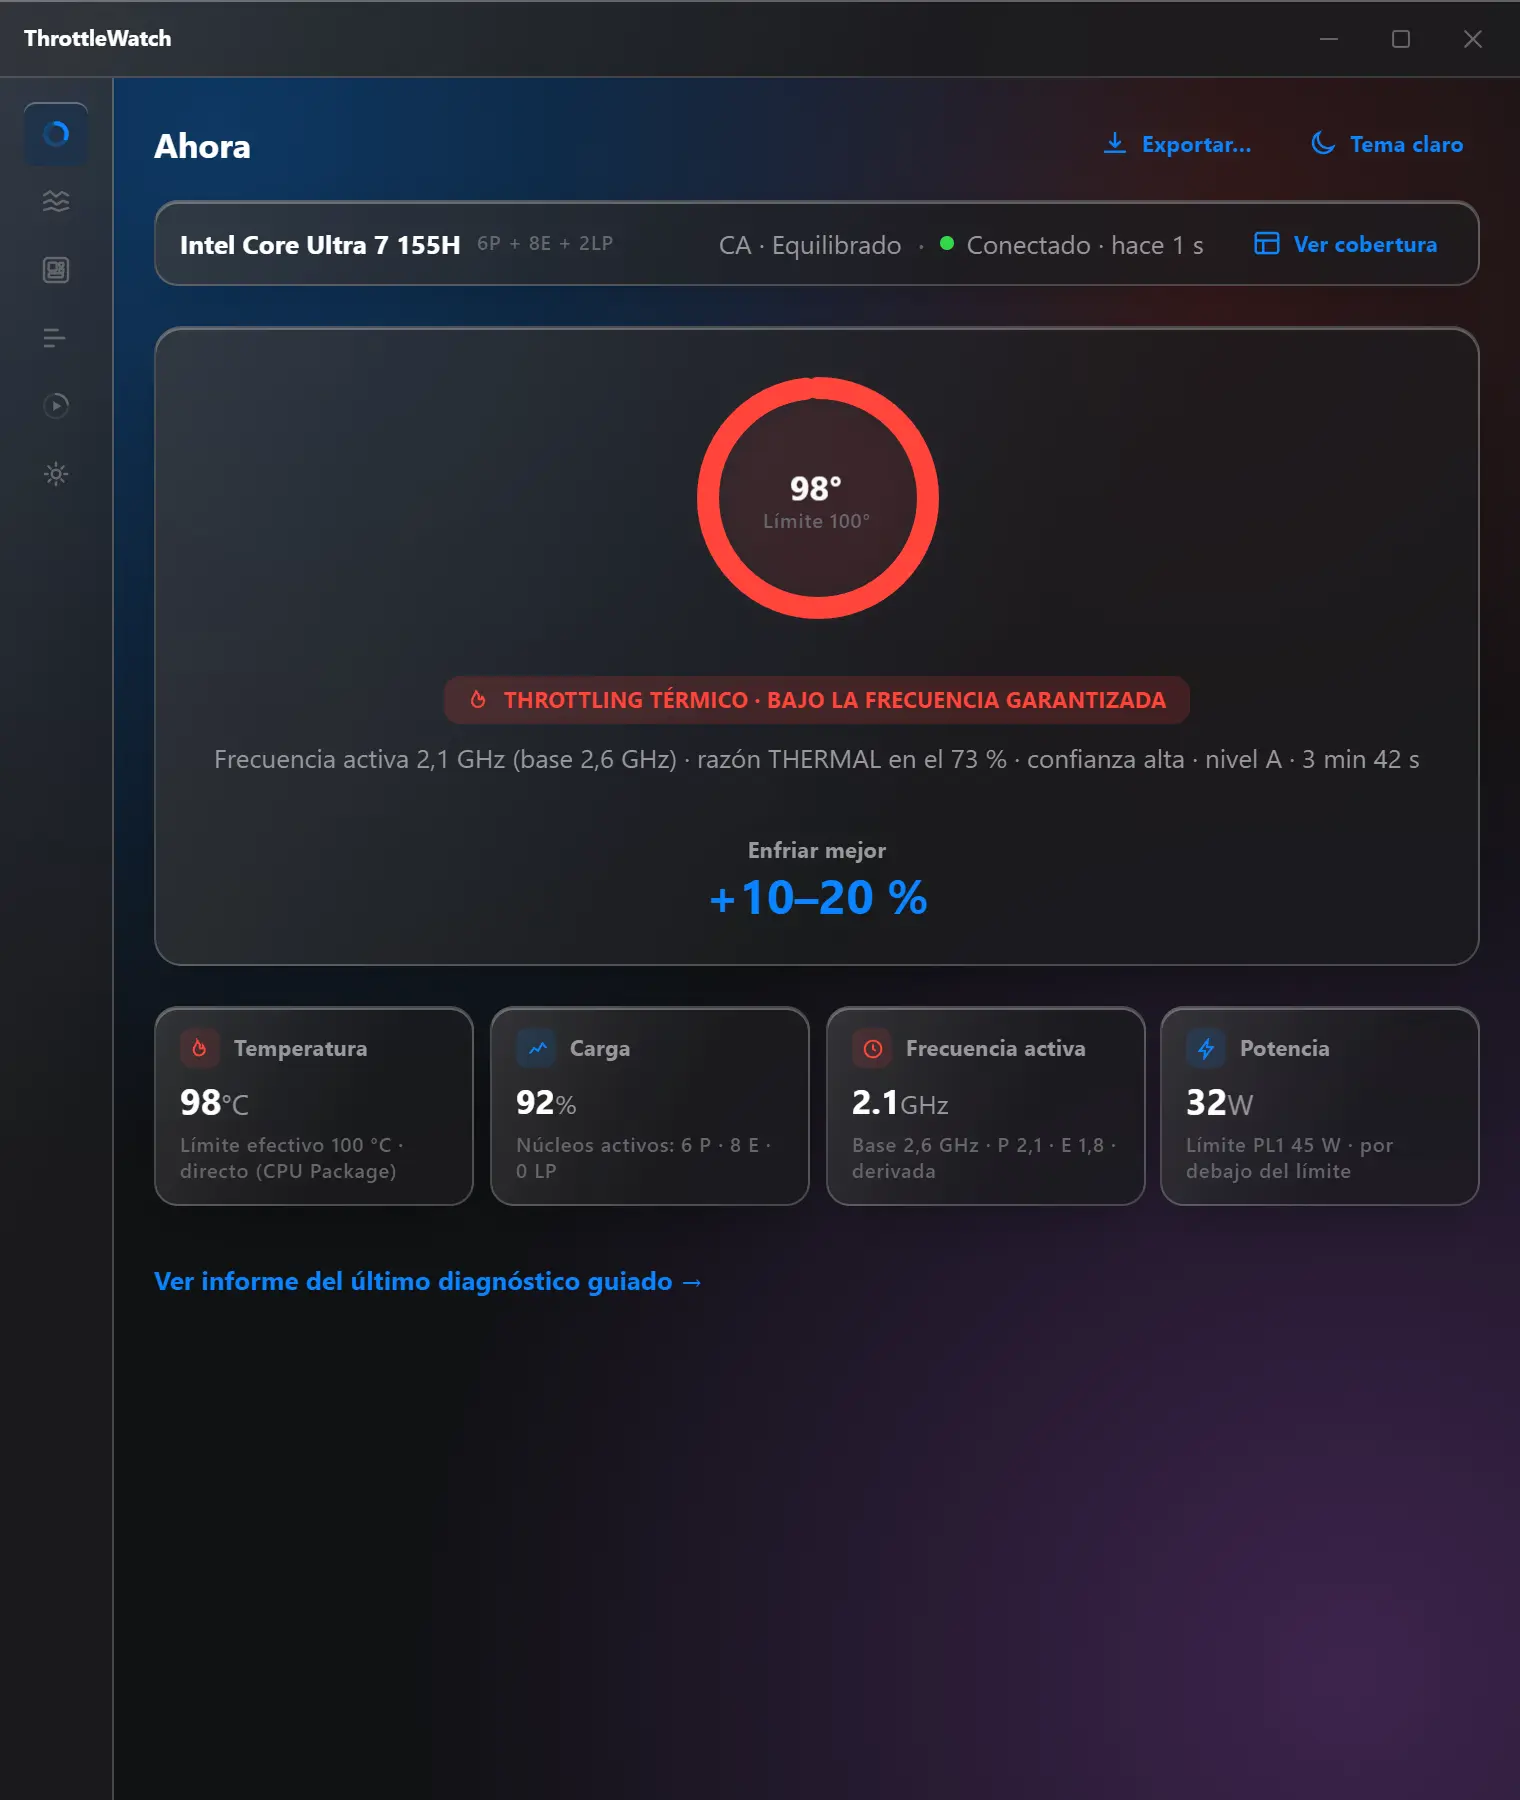
«Nothing gets underlined on hover. It's not a web page inside a window.»
If a sensor is missing, it says so. If the collector crashes, it restarts it.
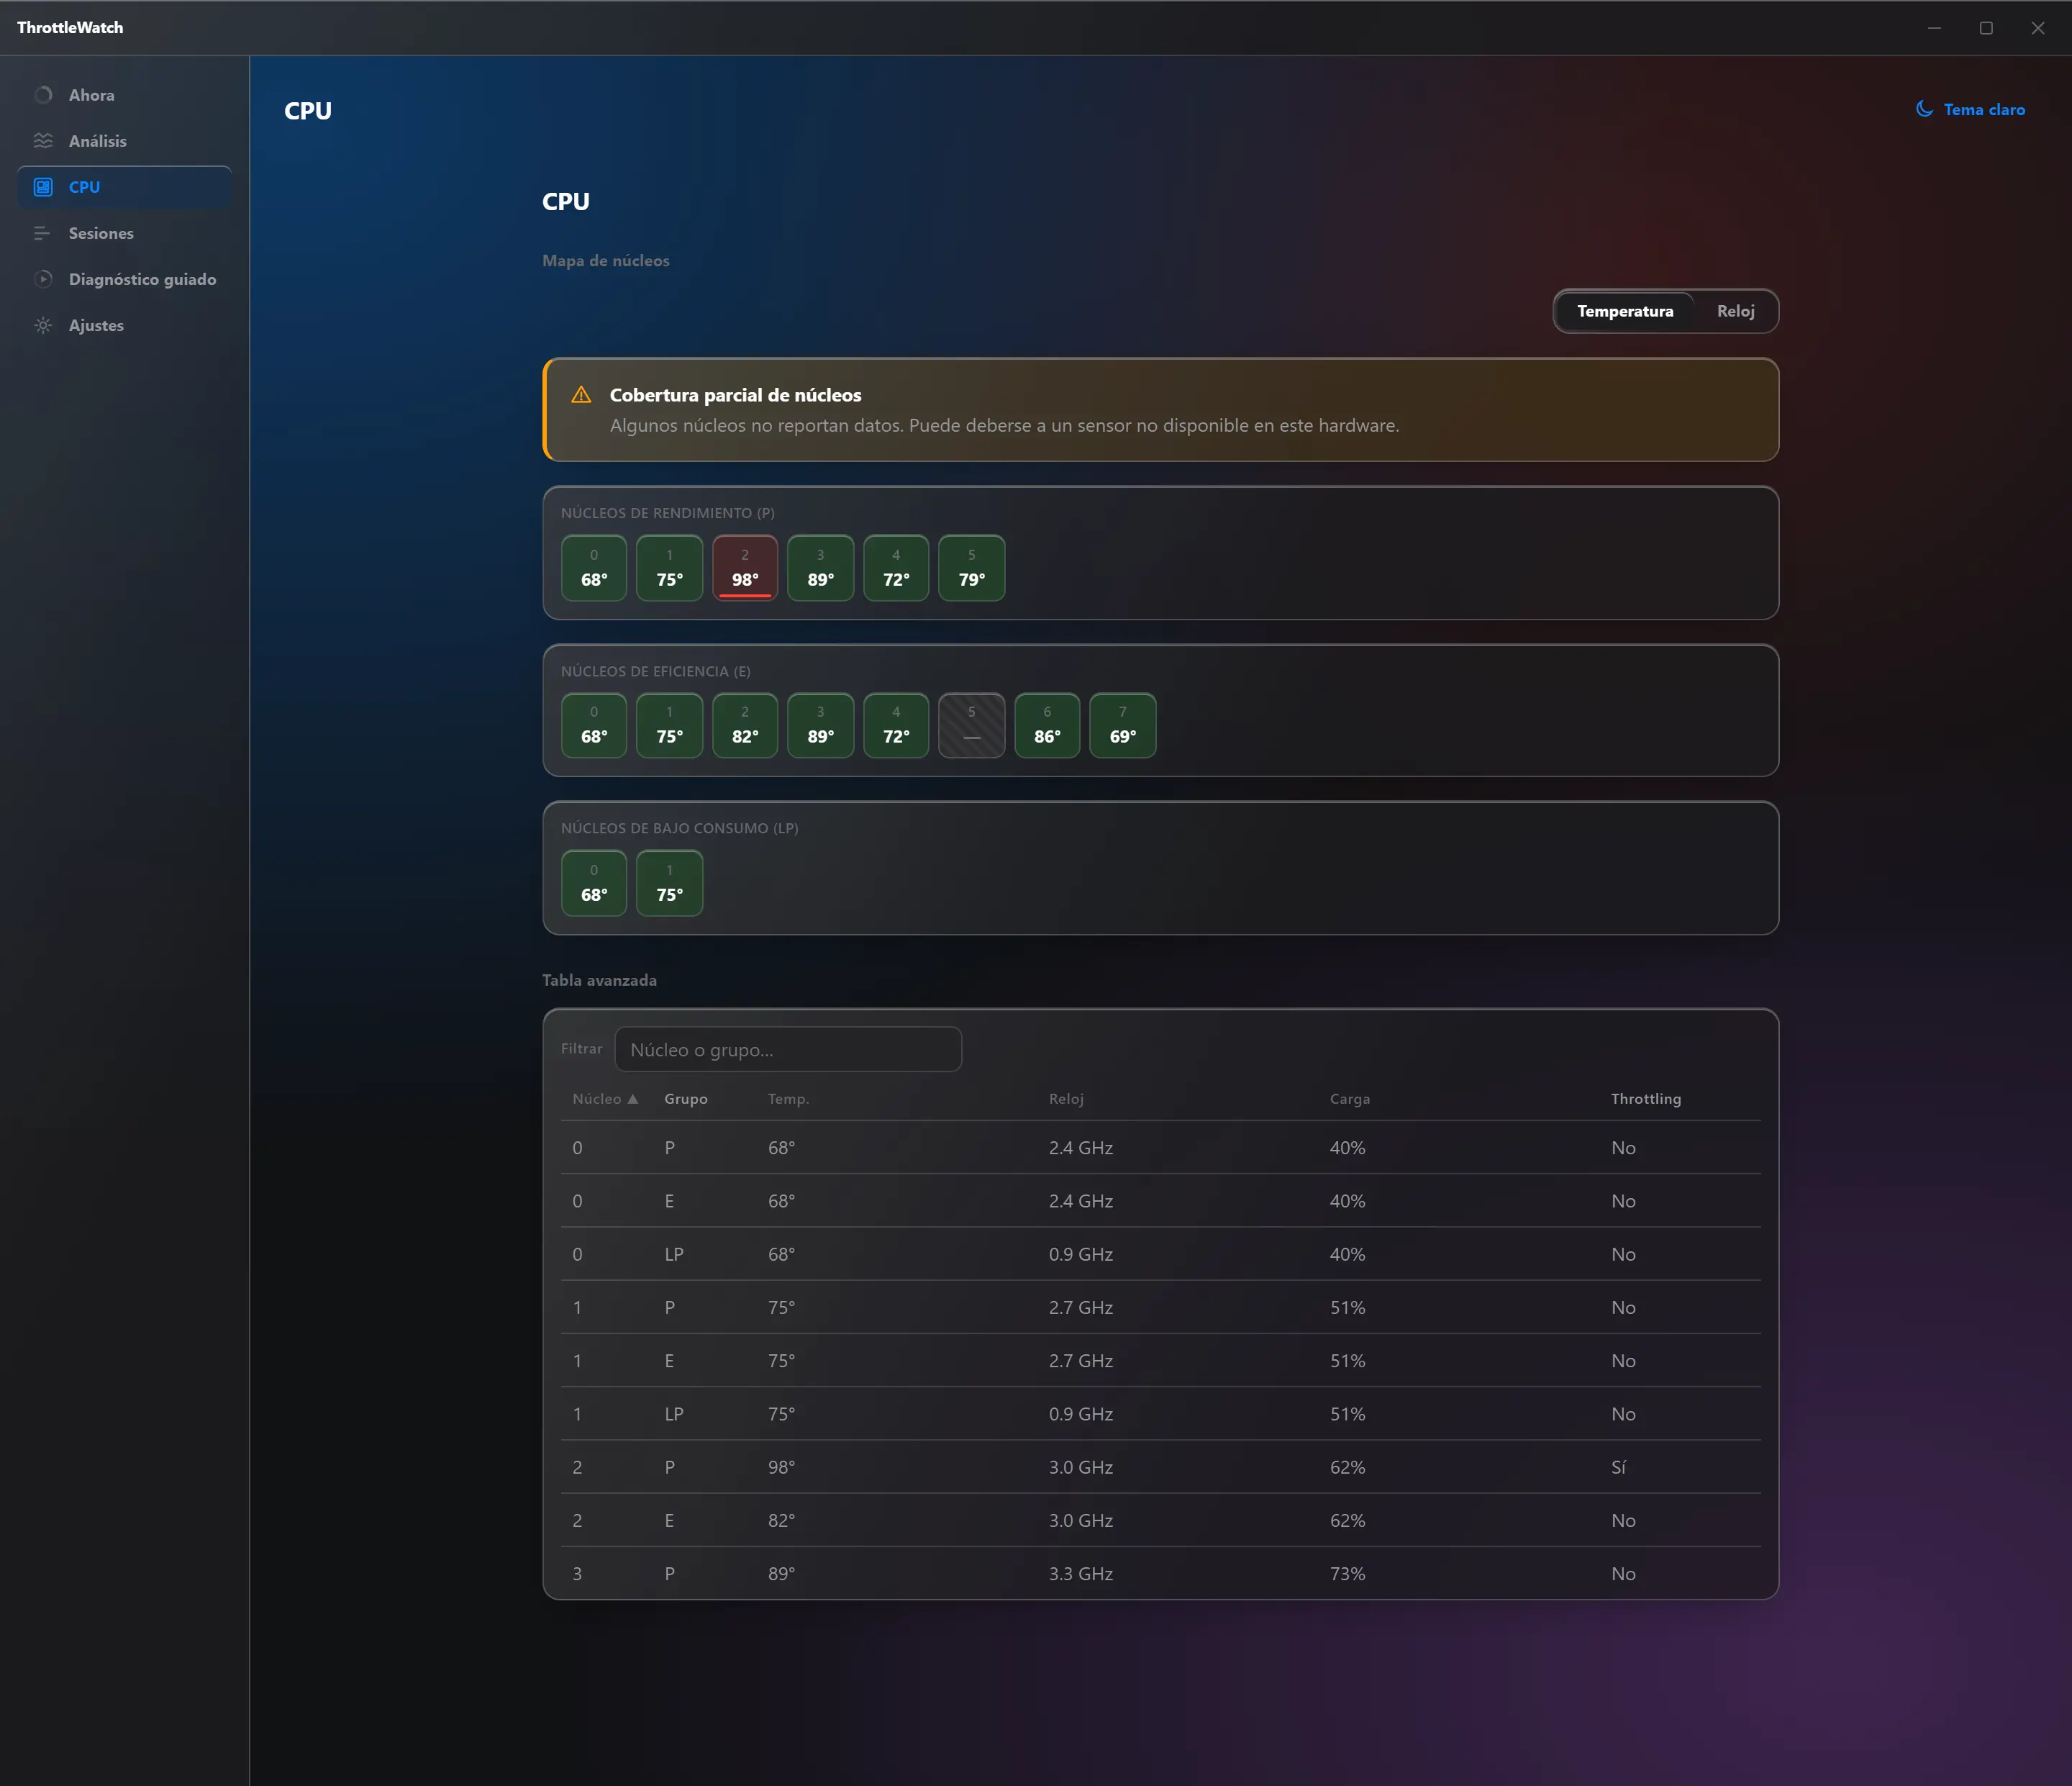
A missing value is shown as "Not available", never as zero. If the sensor process stops, the interface stays alive, warns you and retries. With partial coverage, ThrottleWatch explains what it can and cannot conclude.
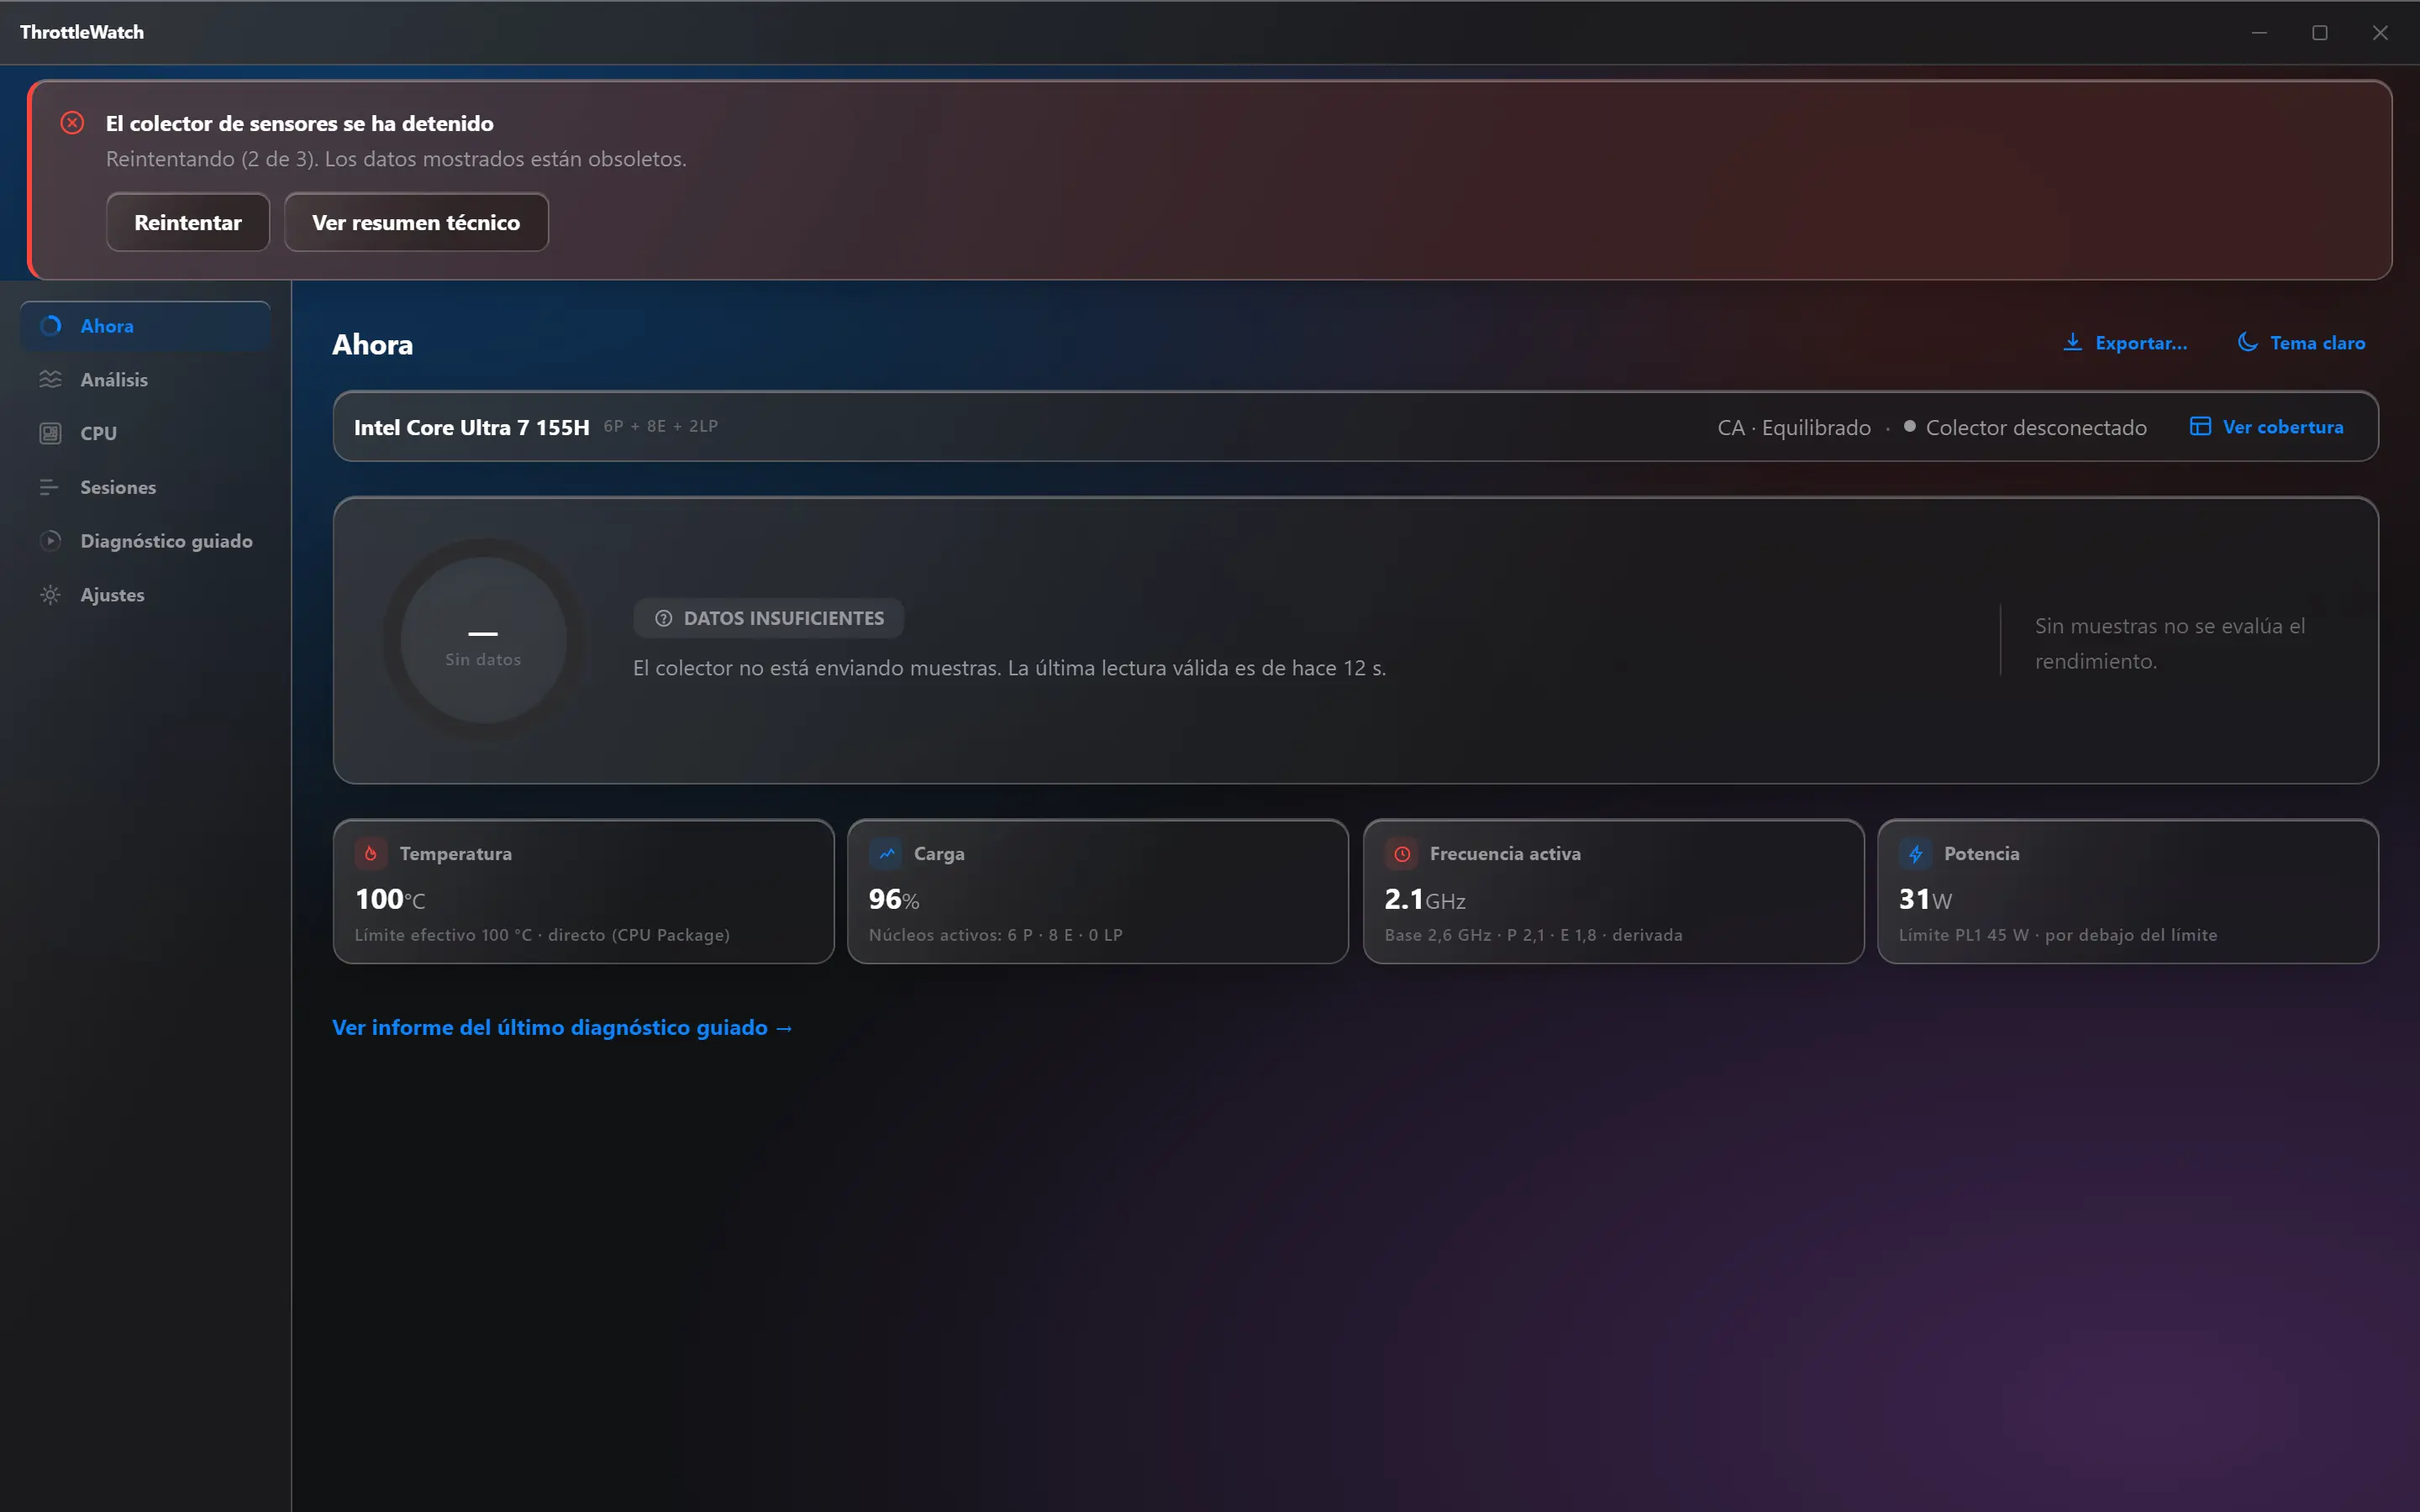
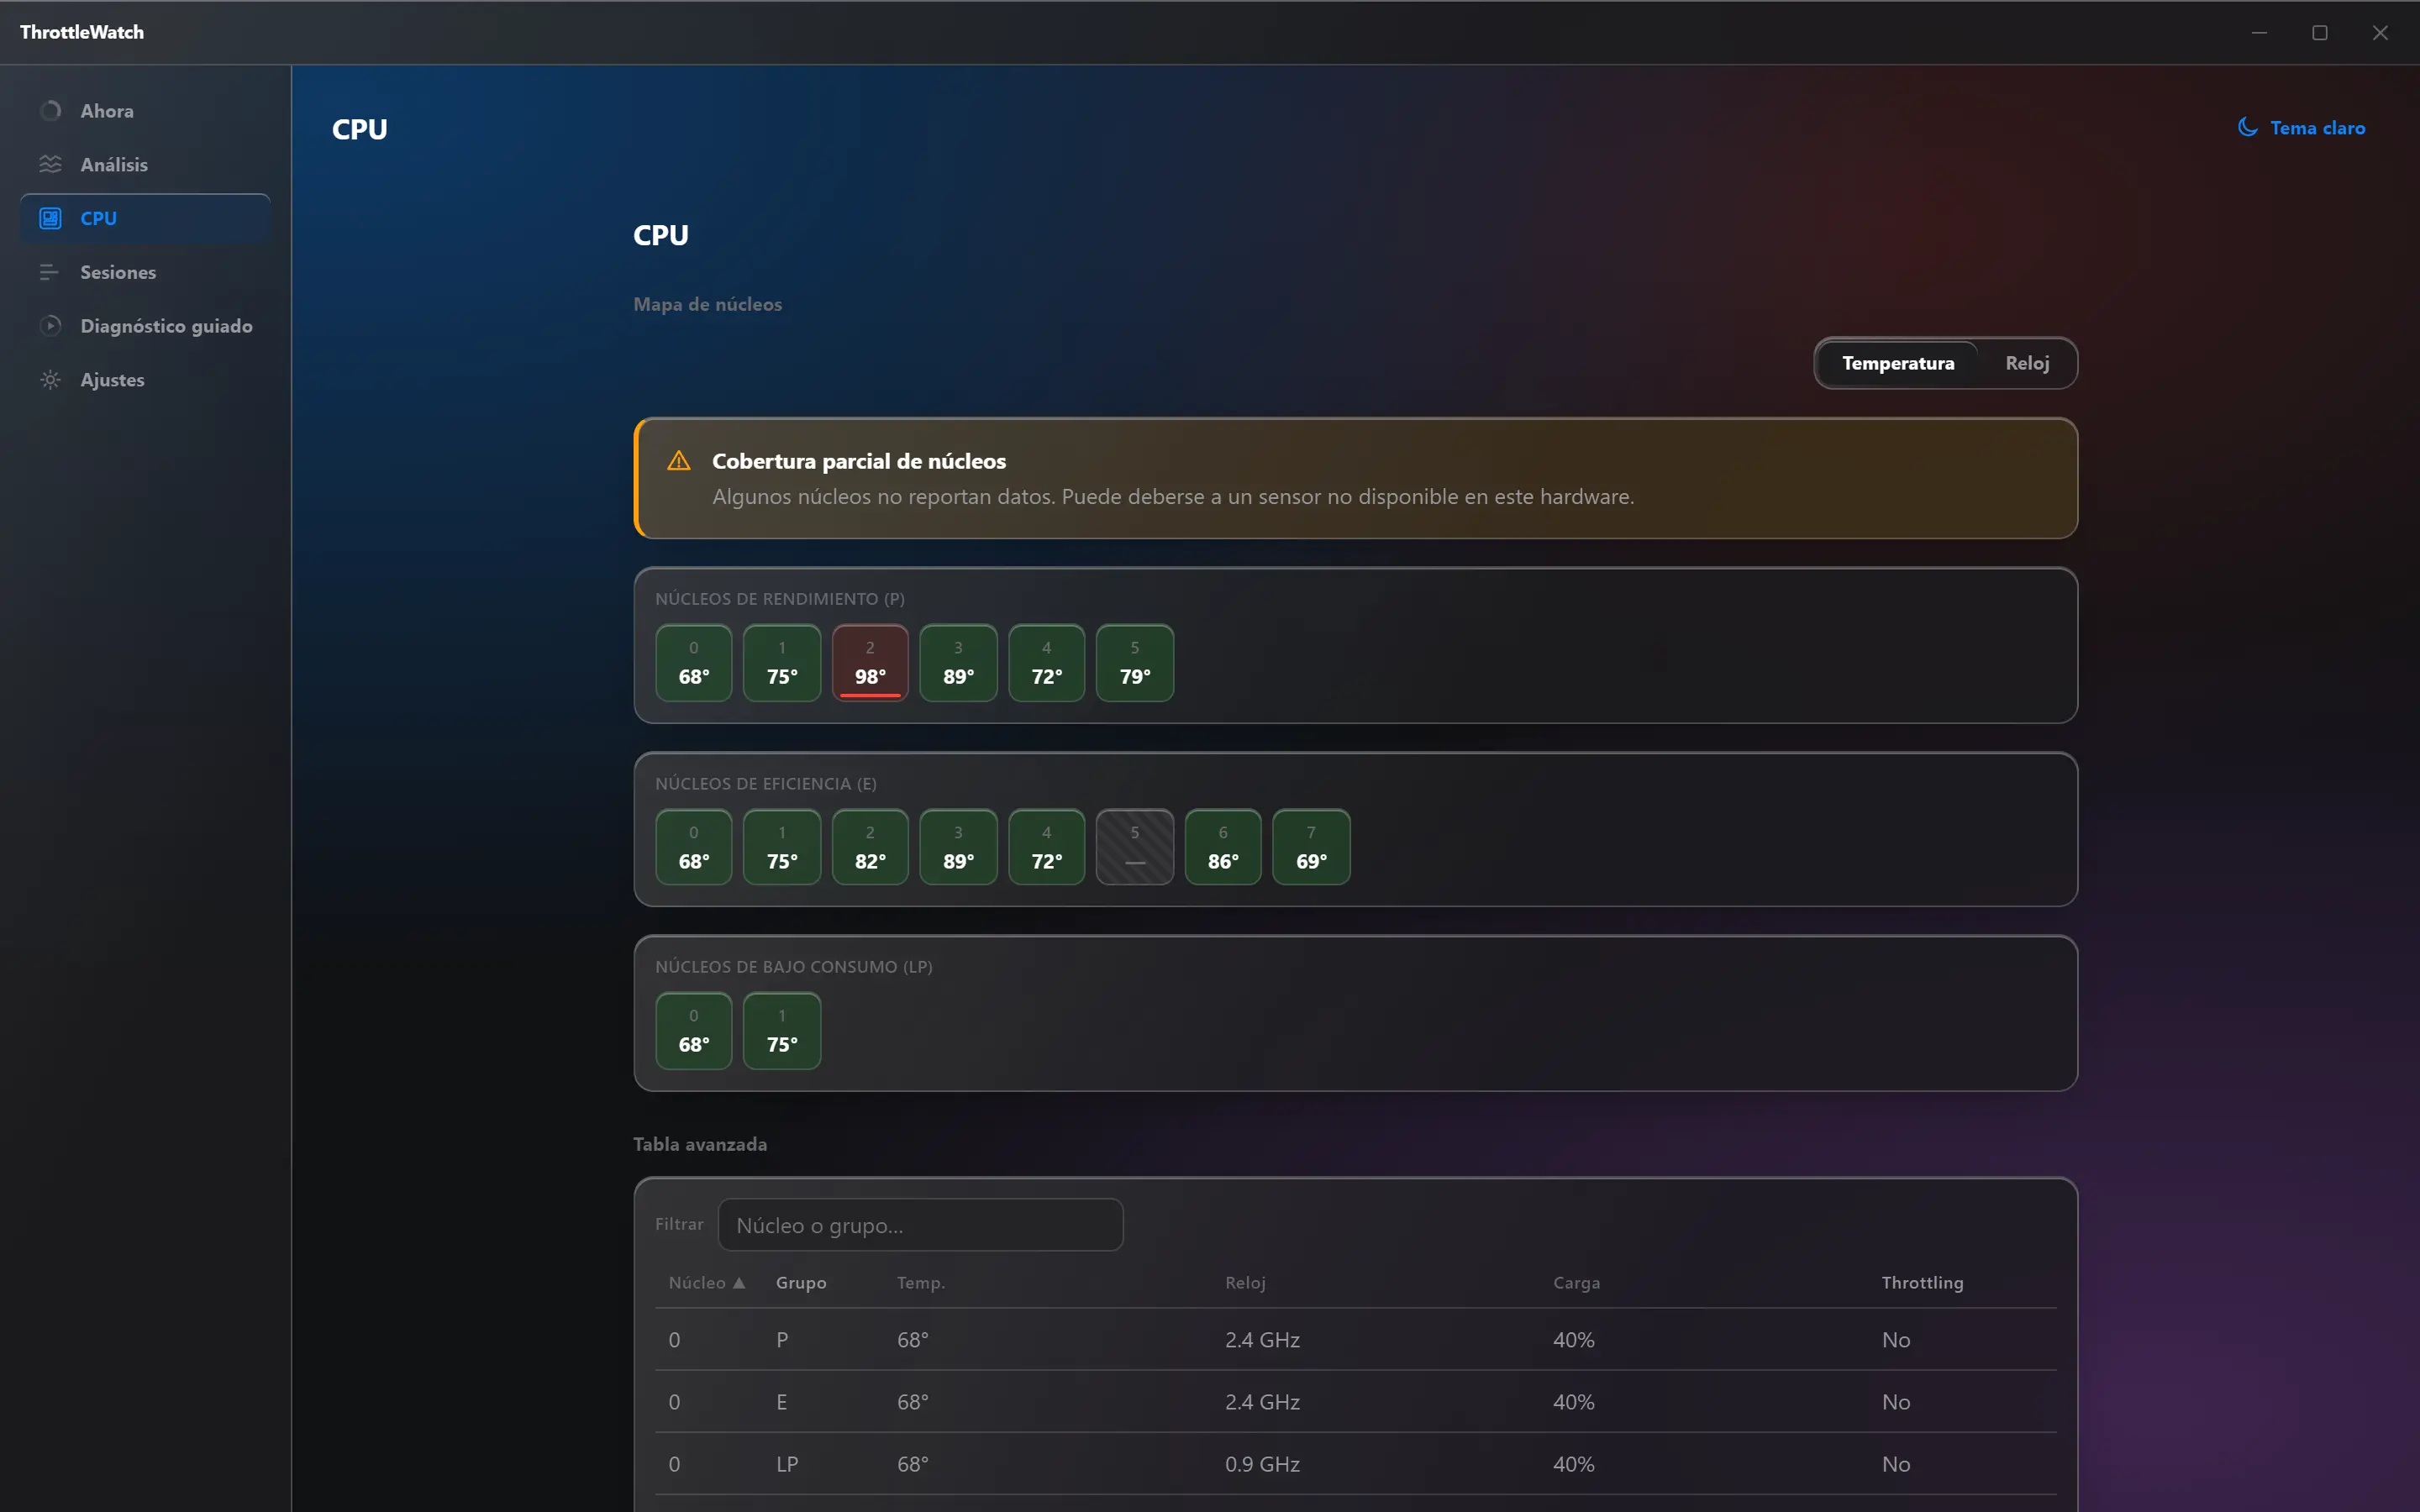
Progressive detail: from plain language to the raw sensor.
THERMAL and PROCHOT reason bits, PL1/PL2/Tau limits, TjMax and TCC offset, per-core active clock, P/E/LP topology. All with its source, quality and age. Exportable to CSV and versioned JSON.
Free. Open. No fine print.
ThrottleWatch is free software under the GPL-3.0 licence. You can read the code, build it, audit it and improve it. There is no "pro" version, no subscription, and no data collection paying for anything.
GPL-3.0Tauri 2 + RustSvelte 5LibreHardwareMonitor (MPL-2.0)Signed installer
Frequently asked questions
Does it need administrator rights?
Not to use it. Advanced sensor access, which lets it confirm the cause and estimate the potential gain, is installed in a separate, optional step that asks for them only once.
Does it change anything on my PC?
Nothing. It doesn't control fans, undervolt or overclock, or change power plans. It only observes and explains.
Does it work with my processor?
Modern Intel and AMD CPUs, plus at least two previous generations of each. If some sensors are missing, the app tells you and remains useful with what's available.
Is the guided diagnostic safe?
Yes. It uses a few minutes of controlled load, has automatic safety stops and can be cancelled at any time. Reaching the temperature limit isn't a failure: the processor protects itself.
What happens to my data?
It stays in your Windows profile. You can export it anonymised, delete it or reset the app completely.
What about updates?
Turned off by default. If you turn them on, checking, downloading and installing are three separate actions, and only signed releases are installed.
Mac or Linux?
Not for now. Windows 10/11 x64 only.
Find out in five minutes.
Download ThrottleWatch, run a guided diagnostic and you'll know whether your next upgrade should be cooling or something else.